Category:German-language charts
Jump to navigation
Jump to search
Subcategories
This category has the following 3 subcategories, out of 3 total.
*
G
P
Media in category "German-language charts"
The following 200 files are in this category, out of 218 total.
(previous page) (next page)-
 02 Rebbluetezeiten - 1965-2011 ohne text.png 2,339 × 1,654; 299 KB
-
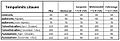 160601 Tempolimit Litauen.jpg 632 × 214; 48 KB
-
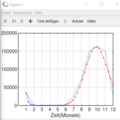
 18-01-13-Tempkurfe.jpg 1,296 × 664; 240 KB
-
 2.Verfeinerung.png 1,325 × 798; 118 KB
-
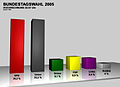
 2005-Herbst.png 742 × 526; 19 KB
-
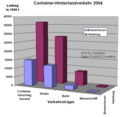 2013 11 16 Container Hinterland Verkehr.png 667 × 651; 31 KB
-
 2013 Hamburg Hafenumschlag 2000 2012 2025.png 848 × 829; 50 KB
-
 Absolutes Vermögen deutscher Haushalte nach Vermögensgruppe.png 380 × 713; 19 KB
-
 Airbus vs Boeing.JPG 623 × 512; 41 KB
-
 Akteure des Mobilitätsmanagements.png 601 × 325; 16 KB
-
 Aktive100er.PNG 1,557 × 829; 126 KB
-
 Annuität Tilgungsanteil.PNG 552 × 376; 11 KB
-
 Anteil Nimitz.png 1,096 × 568; 91 KB
-
 Anzahl der Generäle der NVA.jpg 1,143 × 571; 92 KB
-
 AnzahlderRaketenstarts.JPG 1,261 × 873; 202 KB
-
 Aquariumwerte.png 896 × 717; 17 KB
-
 Arabismen im Deutschen.png 646 × 733; 18 KB
-
 Armutsgefährdungsquote Portugal.jpg 453 × 178; 15 KB
-
 ATMW051219.png 693 × 436; 26 KB
-
 Ausgewählte Sparquoten Eurozone 1993-2011.png 558 × 345; 22 KB
-
 Ausländische Direktinvestitionen in Deutschland 2009.jpg 1,043 × 600; 36 KB
-
 Ausländische Direktinvestitionen in Deutschland 2010 v2.jpg 669 × 352; 27 KB
-
 Ausländische Direktinvestitionen in Deutschland 2010.jpg 711 × 547; 57 KB
-
 Ausländische Direktinvestitionen in Deutschland 2011.jpg 469 × 258; 17 KB
-
 Ausländische Direktinvestitionen in Deutschland 2012.jpg 599 × 333; 29 KB
-
 Ausländische Direktinvestitionen in Deutschland 2013.jpg 987 × 574; 32 KB
-
 Ausländische Direktinvestitionen in Deutschland 2014.jpg 784 × 403; 36 KB
-
 B6 verkehr.jpg 688 × 420; 107 KB
-
 Badesee Rodgau Besucherentwicklung.png 2,535 × 1,263; 91 KB
-
 Bahn Verkehrsleistung alle.jpg 859 × 563; 117 KB
-
 Barch Evaluation0.JPG 624 × 500; 36 KB
-
 Barch MetrMM0.JPG 624 × 500; 91 KB
-
 Barnis.jpg 3,335 × 4,486; 721 KB
-
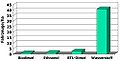
 Barplot 1.png 267 × 204; 19 KB
-
 Barplot 3.png 267 × 206; 30 KB
-
 Barplot 4.png 314 × 183; 31 KB
-
 Barplot 5.png 314 × 183; 32 KB
-
 Barplot 6.png 333 × 203; 36 KB
-
 Barplot 7.png 335 × 186; 19 KB
-
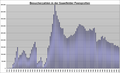
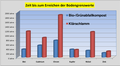 Beaufschlagungsdauer bis zum erreichen des grenzwertes grafik.png 1,546 × 846; 65 KB
-
 Beide Temperaturen.png 972 × 519; 40 KB
-
 Beitrag CO-Konzentration 2014.jpg 549 × 428; 82 KB
-
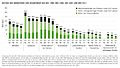 Beitrag der Indikatoren zum Gesamtwert des WHI.jpg 4,550 × 2,584; 602 KB
-
 Belgien - Neue Lehrverträge pro Jahr.png 460 × 229; 12 KB
-
 Besucherzahlen Baradla.PNG 1,419 × 859; 107 KB
-
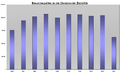
 Besucherzahlen Baumannshöhle.PNG 1,205 × 826; 84 KB
-
 Besucherzahlen Belaer Tropfsteinhöhle.PNG 1,419 × 859; 59 KB
-
 Besucherzahlen Bärenhöhle.PNG 1,205 × 826; 85 KB
-
 Besucherzahlen Demänovaer Eishöhle.PNG 1,419 × 859; 57 KB
-
 Besucherzahlen Demänovaer Freiheitshöhle.PNG 1,419 × 859; 60 KB
-
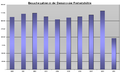
 Besucherzahlen Hermannshöhle.PNG 1,205 × 826; 45 KB
-
 Besucherzahlen Kluterthöhle.PNG 1,205 × 826; 92 KB
-
 Besucherzahlen Saalfelder Feengrotten.PNG 1,419 × 865; 119 KB
-
 Besucherzahlen Schertelshöhle.PNG 1,419 × 859; 93 KB
-
 Besucherzahlen Schillathöhle.PNG 1,419 × 859; 50 KB
-
 Besucherzahlen Schlossberghöhle.PNG 1,419 × 859; 70 KB
-
 Besucherzahlen Tapolcai.PNG 1,419 × 859; 89 KB
-
 Besucherzahlen Tiefenhöhle.PNG 1,046 × 615; 28 KB
-
 Bevölkerung nach Geschlecht und Altersgruppen Schwerte 2020.png 952 × 673; 21 KB
-
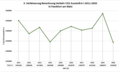
 Bevölkerungsentwicklung-Israel-1948-2014.png 823 × 559; 45 KB
-
 Bevölkerungspyramide Mülheim an der Ruhr 2011.png 735 × 589; 15 KB
-
 Bezugssysteme uebersicht.jpg 905 × 269; 61 KB
-
 Bio fuel efficiency.jpg 500 × 256; 14 KB
-
 Blaustein gemeinderat 2004.png 400 × 321; 35 KB
-
 Blaustein gemeinderat 2009.png 400 × 270; 48 KB
-
 Bolt Berlin-Peking.pdf 1,239 × 1,754; 21 KB
-
 BTW05 1ho re ARD.jpg 895 × 652; 83 KB
-
 BTW05 ho re 2257 ARD.jpg 895 × 652; 138 KB
-
 BTW05 VAE CDU CSU Stapel.jpg 895 × 652; 146 KB
-
 BTW05 VAE CDU CSU.jpg 895 × 652; 138 KB
-
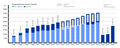
 Chart Umsatz Einhell 2011-2021.jpg 931 × 584; 55 KB
-
 Charta der Vielfalt - Unterzeichner.png 1,007 × 856; 58 KB
-
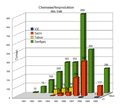 Chemiewaffenprogramm des Irak.png 610 × 550; 30 KB
-
 CO2 an einem Tag ohne Diesel.png 750 × 449; 11 KB
-
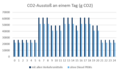
 CO2 Ausstoß an einem Tag mit allen Verkehrsmitteln.png 602 × 395; 8 KB
-
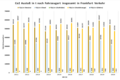 Co2 Ausstoß in t nach Fahrzeugart insgesamt in Frankfurt am Main Verkehr.png 1,169 × 780; 105 KB
-
 CO2 Ausstoß in t Prognose Verfeinerung Darstellung.png 1,221 × 591; 95 KB
-
 CO2 Emission Verkehr in t in Frankfurt am Main 2011-2030.png 816 × 442; 52 KB
-
 CO2 Emissions in 1990 and 2012 de.svg 680 × 900; 26 KB
-
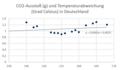 CO2 und Temperatur.png 726 × 425; 11 KB
-
 Crowdfunding from Idea to Project.png 1,093 × 919; 64 KB
-
 Crowdfunding Kickstarter Startnext.png 585 × 353; 13 KB
-
 Crowdfunding-history.JPG 1,312 × 485; 64 KB
-
 D(A) Ingestion.svg 512 × 384; 111 KB
-
 Death note german.png 1,508 × 731; 159 KB
-
 Der postmaterialistische Wertewandel 1970.png 835 × 499; 6 KB
-
 Dezimierung der KEF-Population durch Spritzen im August.png 542 × 412; 20 KB
-
 Dezimierung der KEF-Population durch Spritzen im Juli.png 553 × 497; 21 KB
-
 Diagram earthquake.png 792 × 612; 18 KB
-
 Diagramm 1 mittlere Geschwindigkeit.png 575 × 330; 14 KB
-
 Diagramm 2 mittlere Geschwindigkeit.png 572 × 323; 12 KB
-
 Diagramm AnnuitätentilgungRestschuld.png 923 × 641; 30 KB
-
 Druckerfx.png 780 × 600; 91 KB
-
 DWDS Wort Stilmoebel 2018-02-02.jpg 478 × 411; 31 KB
-
 Dyn Widerstand13.png 839 × 839; 8 KB
-
 Dyn Widerstand15.png 839 × 839; 8 KB
-
 EAWS-Matrix.png 1,771 × 1,211; 149 KB
-
 EESC Langfristig.png 861 × 906; 147 KB
-
 Effect of the Montreal Protocol.svg 600 × 550; 12 KB
-
 Eis-Verbrauch in Europa.jpg 530 × 321; 70 KB
-
-
-
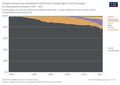
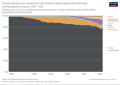
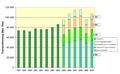
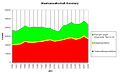
 Energieverbrauch nach Energieträgern, Deutschland, 1965-2021.svg 850 × 600; 57 KB
-
 England marc.jpg 371 × 234; 51 KB
-
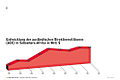 Entwicklung der ADI in Subsahara-Afrika - HBS.jpg 1,024 × 683; 83 KB
-
 Entwicklung der Ausstellerzahlen 2013.png 501 × 299; 9 KB
-
 Entwicklung der Besucherzahlen 2013.tif 582 × 303; 22 KB
-
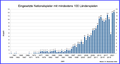
 Entwicklung der nicht erwerbstätigen Mütter (D).png 1,202 × 638; 32 KB
-
 Erdbeben in Osttimor.png 967 × 527; 20 KB
-
 Ergebnis vom 17.02.2012 von Currywurstbude.svg 744 × 850; 15 KB
-
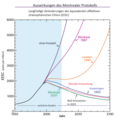
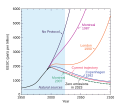
 Europäische Buchproduktion 500–1800.png 1,471 × 953; 22 KB
-
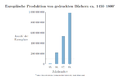 Europäische Produktion von gedruckten Büchern ca. 1450–1800.png 1,404 × 953; 63 KB
-
 Europäische Produktion von Manuskripten 500–1500.PNG 1,421 × 953; 67 KB
-
 FAS-Schülerzahlen Stand 2017.png 837 × 402; 26 KB
-
 Fauna der Kieler bucht (1872) (20579450372).jpg 3,204 × 1,428; 874 KB
-
 FGC by Country.jpg 927 × 428; 93 KB
-
 Firearms export.png 537 × 433; 13 KB
-
 Flakbatterien Berlin.jpg 1,135 × 697; 97 KB
-

-
 Free relatives.jpg 1,570 × 485; 200 KB
-
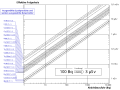
 Frequency of demonstratives.jpg 872 × 1,010; 210 KB
-
 Gagen1.png 3,182 × 2,443; 238 KB
-
 Gemeindesteuern2013.png 882 × 534; 93 KB
-
 Gera Einwohnerentwicklung3.jpg 1,328 × 809; 93 KB
-
 Germany first year mathematics engineering science.PNG 1,056 × 552; 41 KB
-
 Ges Schienen Gütertransport D 1997bis2010.png 970 × 601; 32 KB
-
 Getreide-flächen-ertrag-welt.png 932 × 706; 36 KB
-
 Graph der Population.png 539 × 539; 36 KB
-
 Groesse der Toleranzfelder.gif 383 × 329; 6 KB
-
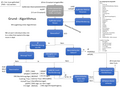 GrundAlgoMitUnterAlgoV2.png 1,545 × 1,136; 149 KB
-
 Hinrichtungen in Rom.png 1,476 × 1,207; 2.96 MB
-
 Hofstede Niederlande-Schweiz.png 1,624 × 737; 54 KB
-
 IL Grafik Fachbereiche D.jpg 1,630 × 1,918; 583 KB
-
 Informationsparadoxon.png 500 × 500; 6 KB
-
 IPS Alumni-Konferenz in Moskau.jpg 3,456 × 2,304; 1.03 MB
-
 Is COVID-19 like a flu? DEU.png 2,419 × 1,822; 313 KB
-
 Jevons-the coal question.png 874 × 589; 90 KB
-
 Keine Abschreckung.PNG 615 × 436; 11 KB
-
 Klima-antreiber nach hansen 2005.jpg 1,230 × 475; 213 KB
-
 Klima-antreiber nach hansen 2005.png 1,230 × 474; 13 KB
-
 Kreditgewaehrung im Gleichschritt (Gestrich 1936).png 1,439 × 703; 432 KB
-
 Langzeittrend Tötungsdelikte.jpg 881 × 592; 111 KB
-
 Lebenserwartung 1960-2008.png 725 × 321; 12 KB
-
 LiLo Fahrgastzahlen.png 1,343 × 861; 52 KB
-
 Lkw-Maut in Deutschland.png 1,042 × 688; 60 KB
-
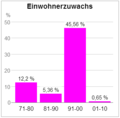
 Loveparade Besucher 91-10.png 920 × 383; 18 KB
-
 Marktdynamik.png 493 × 305; 12 KB
-
 MBL8.png 839 × 839; 10 KB
-
 Military Budget BIP.png 894 × 690; 33 KB
-
 Mischungskorrossion.png 775 × 403; 7 KB
-
 Mitgliederstatistik dlrg.png 2,000 × 1,708; 224 KB
-
 Mitgliederzahl parteien Österreichs - Party membership of parties in Austria.png 5,391 × 3,239; 507 KB
-
 Mitgliederzahlen GfDP 1952-60.jpg 750 × 563; 139 KB
-
 Mobiler Service Vergleich Rechnungsabwicklung.jpg 2,826 × 1,861; 566 KB
-
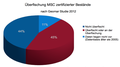 MSC zertifizierte Bestände - überfischte und fast überfischte in Prozent.png 1,388 × 780; 101 KB
-
 MVM 15-1 Grafik für Wikipedia.jpg 1,365 × 1,024; 182 KB
-
 Männerspagat lineare Regression.png 744 × 632; 41 KB
-
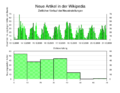 Neue Artikel Stundengang.png 1,584 × 1,224; 43 KB
-
 NormalWithClaytonDependence.png 942 × 496; 13 KB
-
 Ölverbrauch Südostasiens ohne Singapure.jpg 752 × 527; 39 KB
-
 Paläoanthropology.JPG 705 × 449; 35 KB
-
 PopulationTxdeFreitas.png 397 × 369; 10 KB
-
 Preisindex01.png 792 × 612; 15 KB
-
 Pro-Kopf-Einkommen, Ländervergleich 2008.jpg 919 × 599; 264 KB
-
 Prognose und Konfidenzintervalle CO2 Ausstoß in t 2021 bis 2030.png 768 × 395; 50 KB
-
 Rebbluete 1965-2010 GV Krems.JPG 2,159 × 1,477; 194 KB
-
 RegionalWikisInGermanyAustriaSwitzerland2016.jpg 700 × 700; 126 KB
-
 Regressionsgerade Höhepunkte der KEF-Population.png 823 × 491; 47 KB
-
 Reichenvergleich - EPA.png 861 × 684; 30 KB
-
 Roesrath Einwohnerentwicklung 2004b.png 287 × 194; 4 KB
-
 Rogers 4 Stufen-Modell.png 350 × 155; 9 KB
-
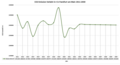
 SAIDI-Deutschland-2006-2011.png 721 × 390; 17 KB
-
 SAIDI-Deutschland-2006-2012.png 741 × 380; 4 KB
-
 Schrotflinten.png 815 × 497; 16 KB
-
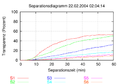 SepDiaDisperseSeparation.png 401 × 281; 35 KB
-
 Sieggquote-Niederlande.PNG 1,462 × 747; 63 KB
-
 Sinus Milieus in Deutschland, Österreich und der Schweiz.png 862 × 517; 158 KB
-
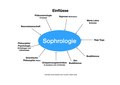 Sophrologie, Einflüsse.pdf 1,754 × 1,239; 96 KB
-
 Spenden.png 792 × 612; 14 KB
-
 StA-Konstanz-2005.JPG 646 × 387; 79 KB
-
 StA-Konstanz-2006.JPG 919 × 566; 92 KB
-
 StA-Konstanz-2008.jpg 934 × 574; 131 KB
-
 Statistik jüdische Einwohnerschaft von Jever 1735 - 1942.jpg 882 × 622; 70 KB
-
 Statistik PAX BER.png 2,500 × 990; 124 KB
-
 Statstik.png 331 × 325; 5 KB
-
 Steuerschätzungen 02.png 967 × 646; 88 KB
-
 Temperaturabwichung.png 750 × 449; 23 KB
-
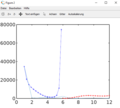
 Titrationskurve schwache Säure.jpg 858 × 511; 65 KB
-
 Titrationskurve starke Säure.jpg 858 × 511; 67 KB
-
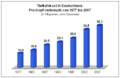 TK-Pro-Kopf-Verbrauch 1977-2007.png 571 × 370; 5 KB
-
 Total-Return.jpg 564 × 310; 63 KB
-
 TV Market Shares Austria 2014 12+ all.png 486 × 1,007; 144 KB
-
 TV Market Shares Austria 2014 November 12+ all AGTT.png 486 × 1,007; 144 KB
-
 TV Market Shares Austria 2015 12+ all AGTT.png 486 × 1,007; 144 KB
-
 TV Market Shares Austria 2015 December 12+ all AGTT.png 486 × 1,007; 144 KB
-
 TV-Total Wahlergebnis.jpg 967 × 603; 50 KB
-
 Umsatz Gesellschaftsspiele in Deutschland.svg 555 × 326; 39 KB
-
 UnternehmensinsolvenzenDeutschland.png 610 × 595; 38 KB
-
 URV-Statistik Detailliert.png 1,584 × 1,224; 35 KB
-
 Vandalismus.png 1,584 × 1,224; 41 KB


_Ingestion.svg)


.png)


_(20579450372).jpg)


.png)


