Category:Gary Johnson graphs
Jump to navigation
Jump to search
Subcategories
This category has only the following subcategory.
Media in category "Gary Johnson graphs"
The following 27 files are in this category, out of 27 total.
-
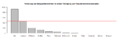
 2016 Libertarian presidential nomination voting (Round 1).png 911 × 279; 7 KB
-
 2016 Libertarian presidential nomination voting (Round 2).png 825 × 281; 6 KB
-
 2016 Presidential Election by Vote Distribution Among States.png 800 × 495; 141 KB
-

-
 Libertarian Presidential Election Results.png 393 × 436; 12 KB
-
 Republican Presidential Primaries 2012.png 917 × 363; 155 KB
-
 Twitter activity of Gary Johnson.png 1,370 × 780; 111 KB
-
 United States presidential election ordinal results bar graph (Expanded).png 9,000 × 3,600; 194 KB
-
 United States presidential election ordinal results bar graph.png 5,000 × 3,600; 138 KB
-
 United States presidential election ordinal results line graph (Expanded).png 4,657 × 3,600; 356 KB
-
 United States presidential election ordinal results line graph.png 4,657 × 3,600; 207 KB
-
 United States presidential election raw popular vote count bar graph (Expanded).png 9,450 × 11,500; 578 KB
-
 United States presidential election raw popular vote count bar graph.png 5,450 × 11,500; 389 KB
-
 United States presidential election raw popular vote count line graph (Expanded).png 5,107 × 11,500; 732 KB
-
 United States presidential election raw popular vote count line graph.png 5,107 × 11,500; 642 KB
-
 United States presidential election results bar graph (Expanded).png 9,000 × 7,000; 318 KB
-
 United States presidential election results bar graph.png 5,000 × 7,000; 207 KB
-
 United States presidential election results line graph (Expanded).png 4,657 × 7,000; 507 KB
-
 United States presidential election results line graph.png 4,657 × 7,000; 443 KB
-

-

-
-
-

-
-
-


.svg)


.png)

.png)

.png)

.png)

.png)


.png)

.png)

.png)
.png)
.png)
.png)