Category:Filter diagrams
Jump to navigation
Jump to search
Subcategories
This category has the following 2 subcategories, out of 2 total.
C
P
- Pole-zero plots (11 F)
Media in category "Filter diagrams"
The following 49 files are in this category, out of 49 total.
-
 1-D frequency response.JPG 221 × 130; 10 KB
-
 Badfiltering.png 299 × 300; 2 KB
-
 Bandfilter.png 623 × 451; 6 KB
-
 BPFAnimation.gif 560 × 420; 6.48 MB
-
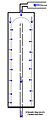 Schematic diagram of a Chamberland filter.jpg 331 × 793; 24 KB
-
 Schematic diagram of a Chamberland filter.svg 331 × 793; 41 KB
-
 Chebyshev mapped z plane.svg 512 × 511; 56 KB
-
 Chebyshev responses.svg 512 × 404; 82 KB
-
 Chebyshev s plane.svg 512 × 519; 55 KB
-
 Elfiltertypen.png 176 × 199; 4 KB
-
 Filt elect pend.PNG 531 × 395; 16 KB
-
 Filter transformation TP BP.PNG 755 × 482; 18 KB
-
 Filter transformation TP HP.PNG 728 × 449; 16 KB
-
 Filtro a 1.PNG 438 × 273; 14 KB
-
 Filtro media onda intensidades.png 372 × 288; 4 KB
-
 Filtro media onda tensiones.png 307 × 217; 2 KB
-
 Filtro paso banda.jpg 123 × 40; 1 KB
-
 Filtro teórico tensiones.png 216 × 217; 2 KB
-
 Filtros electr.PNG 521 × 326; 12 KB
-
 Fir filter typ1 impulsantwort.png 560 × 420; 4 KB
-
 Fir filter typ2 impulsantwort.png 560 × 420; 4 KB
-
 Fir filter typ3 impulsantwort.png 560 × 420; 3 KB
-
 Fir filter typ4 impulsantwort.png 560 × 420; 4 KB
-
 Friis Noise Temperature.png 657 × 412; 32 KB
-
 Gauss-filter-impulsantwort.PNG 949 × 707; 26 KB
-
 Gauss-Filter-Impulsantwort.svg 526 × 394; 32 KB
-
 Gauss-filter-uebertragungsfunktion.PNG 994 × 701; 36 KB
-
 Gauss-Filter-Uebertragungsfunktion.svg 526 × 394; 75 KB
-
 Matched Filter Total System.jpg 881 × 126; 38 KB
-
 Matlab filtro.PNG 356 × 420; 9 KB
-
 Passband schematic2.svg 755 × 758; 14 KB
-
 Passband schematic3.png 640 × 1,043; 62 KB
-
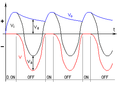
 PD2 filtré, courant d'entrée avec RC = 0,1 s.png 640 × 480; 6 KB
-
 Response curves of low pass filter for different Q.png 400 × 400; 6 KB
-
 Schematic diagram of a Bakerfeld filter.JPG 331 × 793; 24 KB
-
 Second order transfer function.svg 631 × 356; 80 KB
-
 Single-pole frequency response.JPG 643 × 363; 38 KB
-
 Single-pole sine wave response.JPG 643 × 303; 30 KB
-
 Stripline filter lumped equivalents 2.svg 2,286 × 1,652; 222 KB
-
 Toleranzschema Filter Betragsfrequenzgang.svg 291 × 162; 9 KB
-
 Toleranzschema Filter.svg 800 × 450; 24 KB
-
 Ustep 1st iord ty 1 uf nofilt Quantities.png 936 × 454; 8 KB
-
 Ustresp or1 ty1 phal.png 955 × 465; 7 KB
-
 Viscocidad.JPG 268 × 162; 9 KB
-
 Wiener block.png 750 × 210; 8 KB
-
 Wiener block.svg 600 × 180; 32 KB
-
 Zrzut ekranu-FiltrCyfrowy.png 667 × 437; 11 KB
-
 АЧФЧ моста Вина - Робинсона.svg 753 × 513; 4 KB
-
 Фильтр Вина.svg 768 × 295; 31 KB


