Category:Fault tree diagrams
Jump to navigation
Jump to search
failure analysis system used in engineering | |||||
| Upload media | |||||
| Subclass of |
| ||||
|---|---|---|---|---|---|
| |||||
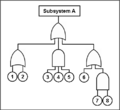
Fault tree diagrams are diagrams use in fault tree analysis: the failure analysis in which an undesired state of a system is analyzed using boolean logic to combine a series of lower-level events. This analysis method is mainly used in the field of safety engineering to quantitatively determine the probability of a safety hazard.
Media in category "Fault tree diagrams"
The following 33 files are in this category, out of 33 total.
-
 And-FT-gate.svg 166 × 317; 3 KB
-
 Ex arbre de défaillances.png 633 × 291; 92 KB
-
 Example Code Fault Tree.jpg 616 × 715; 40 KB
-
 Example of High Level Fault Tree.jpg 512 × 659; 35 KB
-
 Fault Prognosis.jpg 680 × 618; 114 KB
-
 Fault tree.png 490 × 449; 26 KB
-
 Fault tree.svg 660 × 698; 12 KB
-
 FDI Class2.jpg 1,098 × 294; 86 KB
-
 FDI Classification.jpg 1,524 × 407; 144 KB
-
 FT Challenges.jpg 703 × 682; 84 KB
-
 FT-Base-Event.svg 59 × 74; 6 KB
-
 FT-House-Event.svg 59 × 82; 5 KB
-
 FT-Not-Dev-Event.svg 72 × 70; 5 KB
-
 FT-To-Be-Dev-Event.svg 80 × 77; 6 KB
-
 FTA AND gate.jpg 86 × 151; 2 KB
-
 FTA basic event alternate.jpg 160 × 184; 3 KB
-
 FTA basic event.jpg 86 × 151; 2 KB
-
 FTA conditioning event.jpg 146 × 151; 2 KB
-
 FTA inhibit gate.jpg 121 × 151; 2 KB
-
 FTA initiating event.jpg 81 × 151; 2 KB
-
 FTA intermediate event.jpg 137 × 151; 2 KB
-
 FTA OR gate.jpg 86 × 151; 2 KB
-
 FTA priority AND gate.jpg 121 × 151; 2 KB
-
 FTA transfer in.jpg 121 × 151; 2 KB
-
 FTA transfer out.jpg 121 × 151; 2 KB
-
 FTA undeveloped event.jpg 137 × 151; 2 KB
-
 FTA XOR gate.jpg 121 × 151; 2 KB
-
 Koon-FT-gate.svg 166 × 317; 4 KB
-
 Not-FT-gate.svg 166 × 317; 3 KB
-
 Or-FT-gate.svg 166 × 317; 3 KB
-
 SFTA Graphical Representation Symbols.jpg 616 × 658; 75 KB
-
 T2 - SPE index.png 499 × 419; 11 KB
-
 Xor-FT-gate.svg 166 × 317; 3 KB


