Category:Evolutionary statistical charts
Jump to navigation
Jump to search
Subcategories
This category has only the following subcategory.
Media in category "Evolutionary statistical charts"
The following 20 files are in this category, out of 20 total.
-
PSM V59 D460 U of chicago students grouped by stature.png 1,041 × 988; 838 KB
-
PSM V59 D462 Frequency polygon of american statures.png 1,335 × 1,954; 132 KB
-
PSM V59 D463 Frequency curves of selected and unselected daisies.png 1,251 × 773; 140 KB
-
PSM V59 D463 Types of frequency curves.png 930 × 817; 481 KB
-
PSM V59 D464 Polygon of frequencies for body part lengths of insects.png 1,646 × 930; 626 KB
-
PSM V59 D465 Frequency polygons of buttercup petals and pecten shells.png 1,275 × 1,224; 167 KB
-
PSM V59 D466 Statistical curve of the fasciated stems of crepis biennis.png 1,234 × 1,246; 137 KB
-
PSM V59 D467 Frequency polygon of randomly gathered daisies white daisies.png 1,156 × 1,130; 114 KB
-
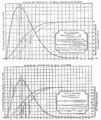
PSM V62 D374 Statistical distribution of historically eminent people.png 1,549 × 1,785; 66 KB
-
PSM V62 D377 Statistical graph of eminent people by nationality.png 848 × 1,084; 78 KB
-
PSM V62 D378 Statistical distribution of eminent people by nationality.png 1,482 × 1,402; 51 KB
-
PSM V62 D379 Statistical curve of human accomplishments.png 1,501 × 1,667; 50 KB
-
PSM V62 D381 Statistical curves of human accomplishments by nationality.png 1,490 × 1,539; 69 KB
-
PSM V62 D506 Graph of relationship between virtues and blood relationships.png 1,658 × 1,858; 116 KB
-
PSM V62 D508 Graph of relationship between virtues and environment.png 1,617 × 804; 72 KB


