Category:European pressphoto agency
Jump to navigation
Jump to search
Media in category "European pressphoto agency"
The following 66 files are in this category, out of 66 total.
-
 BG distribution epa service by category 2009.png 820 × 429; 6 KB
-
 BG distribution epa service by category 2011.png 820 × 429; 6 KB
-
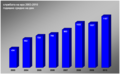
 BG epa service 2003-2008 average image output per day.png 977 × 600; 22 KB
-
 BG epa service 2003-2009 average image output per day.png 977 × 600; 24 KB
-
 BG epa service 2003-2010 average image output per day.png 977 × 600; 26 KB
-
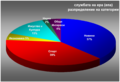 BG epa service 2008 distribution by categories.png 911 × 623; 51 KB
-
 CH epa service 2003-2010 average image output per day.png 977 × 600; 25 KB
-
 CH epa service 2010.png 911 × 623; 51 KB
-
 CHIN epa service 2003-2009 average image output per day.png 977 × 600; 23 KB
-
 CN epa service 2003-2008 average image output per day.png 977 × 600; 21 KB
-
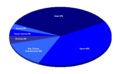
 Distribution epa service by category 2009.png 820 × 429; 6 KB
-
 EN distribution epa service by category 2010.png 489 × 300; 3 KB
-
 EN distribution epa service by category 2011.png 820 × 429; 6 KB
-
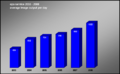
 EN epa service 2003-2009 average image output per day.png 977 × 600; 24 KB
-
 EN epa service 2003-2010 average image output per day.png 977 × 600; 27 KB
-
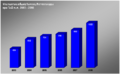
 EN epa service 2003-2011 average image output per day.png 814 × 600; 23 KB
-
 EN epa service 2008 distribution by categories.png 911 × 623; 51 KB
-
 ENG epa service 2003-2010 average image output per day.png 977 × 600; 26 KB
-
 Epa service 2003-2008 average image output per day.PNG 977 × 600; 37 KB
-
 Epa-european-pressphoto-agency-logo 3000x113.png 300 × 113; 18 KB
-
 Epa-european-pressphoto-agency-logo 480x180039.png 480 × 180; 14 KB
-
 European pressphoto agency.gif 180 × 70; 8 KB
-
 FR distribution epa service by category 2009.png 820 × 429; 6 KB
-
 FR distribution epa service by category 2011.png 820 × 429; 6 KB
-
 FR epa service 2003-2008 average image output per day.png 977 × 600; 24 KB
-
 FR epa service 2003-2009 average image output per day.png 977 × 600; 25 KB
-
 FR epa service 2003-2010 average image output per day.png 977 × 600; 26 KB
-
 FR epa service 2008 distribution by categories.png 911 × 623; 52 KB
-
 FR epa service 2010.png 911 × 623; 52 KB
-
 JP distribution epa service by category 2009.png 820 × 429; 5 KB
-
 JP distribution epa service by category 2011.png 820 × 429; 5 KB
-
 JP epa service 2003-2008 average image output per day.png 977 × 600; 22 KB
-
 JP epa service 2003-2009 average image output per day.png 977 × 600; 24 KB
-
 JP epa service 2003-2010 average image output per day.png 977 × 600; 25 KB
-
 JP epa service 2008 distribution by categories.png 911 × 623; 51 KB
-
 JP epa service 2010.png 911 × 623; 51 KB
-
 JP JP epa service 2010.png 911 × 623; 48 KB
-
 JP3 epa service 2010.png 911 × 623; 48 KB
-
 NL distribution epa service by category 2009.png 820 × 429; 6 KB
-
 NL distribution epa service by category 2011.png 820 × 429; 6 KB
-
 NL epa service 2003-2008 average image output per day.PNG 977 × 600; 23 KB
-
 NL epa service 2003-2009 average image output per day.png 977 × 600; 25 KB
-
 NL epa service 2003-2010 average image output per day.png 977 × 600; 27 KB
-
 NL epa service 2008 distribution by categories.png 911 × 623; 52 KB
-
 NL epa service 2010.png 911 × 623; 52 KB
-
 PL distribution epa service by category 2009.png 820 × 429; 6 KB
-
 PL distribution epa service by category 2011.png 820 × 429; 6 KB
-
 PL epa service 2003-2008 average image output per day.png 977 × 600; 23 KB
-
 PL epa service 2003-2009 average image output per day.png 977 × 600; 25 KB
-
 PL epa service 2003-2010 average image output per day.png 977 × 600; 26 KB
-
 PL epa service 2008 distribution by categories.png 911 × 623; 53 KB
-
 PL epa service 2010.png 911 × 623; 53 KB
-
 RU epa service 2003-2008 average image output per day.png 977 × 600; 23 KB
-
 RU epa service 2003-2009 average image output per day.png 977 × 600; 25 KB
-
 RU epa service 2003-2010 average image output per day.png 977 × 600; 26 KB
-
 RU epa service 2003-2011 average image output per day.png 841 × 588; 23 KB
-
 RU epa service 2008 distribution by categories.png 911 × 623; 51 KB
-
 RU epa service 2010.png 911 × 623; 51 KB
-
 TH distribution epa service by category 2009.png 820 × 429; 7 KB
-
 TH distribution epa service by category 2011.png 820 × 429; 7 KB
-
 TH epa service 2003-2008 average image output per day.png 977 × 600; 23 KB
-
 TH epa service 2003-2009 average image output per day.png 977 × 600; 25 KB
-
 TH epa service 2003-2010 average image output per day.png 977 × 600; 26 KB
-
 TH epa service 2008 distribution by categories.png 911 × 623; 61 KB
-
 TH epa service 2010.png 911 × 623; 61 KB
-
 WW epa service 2003-2011 average image output per day.png 814 × 511; 19 KB


