Category:English-language SVG bar charts (vertical)
Jump to navigation
Jump to search
Media in category "English-language SVG bar charts (vertical)"
The following 27 files are in this category, out of 27 total.
-
 1790- United States utility patents issued, by year - bar chart.svg 1,200 × 675; 11 KB
-

-

-
 1940- October global average temperature changes.svg 1,200 × 675; 5 KB
-
 1940- September global average temperature changes.svg 1,200 × 675; 5 KB
-
 1950- High tide flooding, by year - NOAA tide gauges (U.S.).svg 900 × 675; 3 KB
-
 1951- Warm and cold record temperatures - bar chart.svg 1,000 × 700; 6 KB
-
 1976- United States utility patents issued, by year - bar chart.svg 1,250 × 675; 4 KB
-
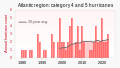 1980- Atlantic region category 4 and 5 hurricanes - NYTimes and NOAA.svg 1,200 × 675; 4 KB
-
-
 1983- Canada wildfires - area burned annually.svg 1,200 × 675; 3 KB
-
 1994- Global average temperature during June-July-August.svg 1,000 × 750; 2 KB
-
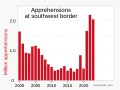 2000- Border apprehensions at southwest border.svg 1,000 × 750; 2 KB
-
 2005 H-1B admissions by country of citizenship.svg 512 × 366; 10 KB
-
 2007- Profits of energy companies (annual) - stacked bar chart.svg 1,200 × 675; 6 KB
-

-
 2008- Oil and gas industry global net income - IEA.svg 1,200 × 675; 3 KB
-
 2009- Floating solar photovoltaic energy production - PV - bar chart.svg 1,000 × 750; 2 KB
-
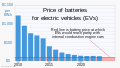 2010- Battery prices for electric vehicles.svg 1,200 × 675; 2 KB
-

-
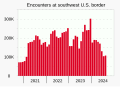 2020- Encounters at U.S. southwest border.svg 1,000 × 720; 3 KB
-
 2020- Title 42 expulsions - southwest U.S. border.svg 1,000 × 750; 3 KB
-
 2023 CDC recommendations for amount of sleep needed, by age vi.svg 1,000 × 750; 6 KB
-
 2023 CDC recommendations for amount of sleep needed, by age.svg 1,000 × 750; 9 KB
-
 Arrivals into the EU via the Mediterranean from 2008 onwards (UNHCR).svg 1,728 × 878; 45 KB
-

-
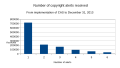 Copyright-alerts-chart.svg 567 × 319; 10 KB


.svg)


_-_stacked_bar_chart.svg)


_-_bar_chart.svg)


.svg)
pyrene_Concentration_in_Processed_Yerba_Mat%C3%A9_Leaves_Sampled_in_2006,_2008,_and_2010_-_Column_Chart.svg)
