Category:Energy use trends
Jump to navigation
Jump to search
Media in category "Energy use trends"
The following 56 files are in this category, out of 56 total.
-
 10 YR Electric Energy Consumption 2005-2015.jpg 480 × 378; 52 KB
-
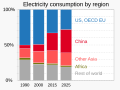 1990- Electricity consumption - shares by region - IEA data.svg 1,000 × 750; 2 KB
-
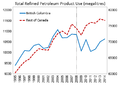 BC Petroleum product use.png 780 × 560; 45 KB
-
 Bitcoin electricity consumption best-guess estimate.png 3,806 × 2,208; 658 KB
-
 Bitcoin electricity consumption.svg 810 × 630; 412 KB
-
 Bitcoin Elektrizitätsverbrauch.png 2,782 × 1,240; 543 KB
-
 China-energy-consumption-by-source.svg 850 × 600; 46 KB
-
 Conso finale par énergie France.jpg 522 × 340; 32 KB
-
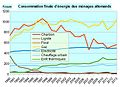 Conso finale énergie ménages allemands.jpg 442 × 321; 28 KB
-
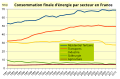 Conso finale énergie par secteur France.svg 489 × 319; 50 KB
-
 Conso prod pétr par secteur France.jpg 529 × 348; 34 KB
-
 Conso éner finale Allemagne cumul.jpg 442 × 321; 25 KB
-
 Conso éner finale Allemagne.jpg 442 × 306; 24 KB
-
 Conso éner finale par agent Allemagne cumul.jpg 442 × 302; 28 KB
-
 Conso éner finale par agent Allemagne.jpg 442 × 295; 30 KB
-
 Conso éner prim Allemagne.jpg 442 × 302; 27 KB
-
 Cost Analysis.JPG 540 × 352; 20 KB
-
 Dobowy i roczny model zużycia energii elektrycznej 1928.jpg 5,184 × 3,888; 4.95 MB
-
 E2 Evolution de la production et de l'utilisation d'énergie en Turquie.png 1,123 × 794; 187 KB
-
 Energia renovelabla - Consumacion d'energia mondiala 1994-2019.png 712 × 842; 67 KB
-
 Energoresursu patēriņš Latvijā.png 489 × 325; 117 KB
-
 Energoresursu patēriņš transporta nozarē.png 469 × 319; 101 KB
-
 Energy consumption by source Australia.png 3,400 × 3,154; 1.06 MB
-
 Energy consumption by source, OWID.svg 850 × 600; 47 KB
-
 Energy Use by Fuel Type.svg 425 × 319; 25 KB
-
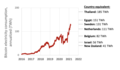
 Filipiinid.jpg 535 × 382; 72 KB
-
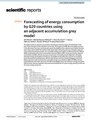 Forecasting of energy consumption by G20 countries using an adjacent accumulation grey model.pdf 1,239 × 1,629, 23 pages; 3.94 MB
-
 Global energy consumption by source (substitution method), OWID.svg 850 × 600; 46 KB
-

-
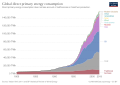
 Global primary energy consumption by source 1900 - 2021.png 3,400 × 2,400; 525 KB
-
 Global primary energy consumption by source, OWID.svg 850 × 600; 13 KB
-
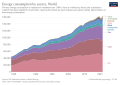
 Global primary energy consumption, OWID.svg 850 × 600; 54 KB
-
 Global renewable energy consumption, OWID.svg 850 × 600; 16 KB
-
 Global-primary-energy (1).png 3,400 × 2,400; 488 KB
-
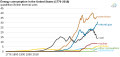
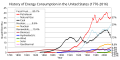 History of energy consumption in the United States.svg 800 × 400; 35 KB
-
 Japan energy & GDP.png 1,160 × 800; 49 KB
-
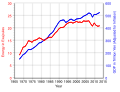 Japan energy and GDP.svg 750 × 570; 15 KB
-
 Preisindex01.png 792 × 612; 15 KB
-
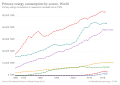 Primary energy consumption by source, OWID.svg 850 × 600; 24 KB
-
 Primary energy consumption by world region, OWID.svg 850 × 600; 26 KB
-
 Renewable energy consumption vs. GDP per capita, OWID.svg 850 × 600; 44 KB
-
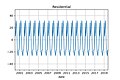 Residential seasonal.jpg 1,800 × 1,200; 313 KB
-
 Restlast BZN DE-LU Jan 2020 nach Entso-E.png 1,056 × 600; 29 KB
-
 Restlast BZN DE-LU Januar 2020 nach Entso-E.png 1,056 × 600; 29 KB
-
 Share of global primary energy consumption by source, OWID.svg 850 × 600; 13 KB
-
 The annual maximum power load 1893-1923 in Kristiania.jpg 400 × 600; 156 KB
-
 TPES outlook.jpg 754 × 565; 47 KB
-
 US energy consumption by source 1800-2010 semilog.png 1,024 × 768; 65 KB
-
 US energy consumption by source semilog.png 1,024 × 768; 52 KB
-
 US energy consumption.svg 864 × 480; 96 KB
-
 US historical energy consumption 1776-2018.svg 588 × 276; 47 KB
-
 US historical energy consumption.png 583 × 290; 29 KB
-
 Windandsolar.png 640 × 480; 22 KB
-
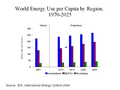 World energy use per capita and region 1970-2025.png 960 × 720; 39 KB
-
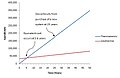
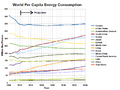 World per capita energy consumption projection.png 1,024 × 768; 49 KB
-
 Éner finale cons par secteur Allemagne.jpg 442 × 310; 24 KB


,_OWID.svg)


.png)


