Category:Elasticity-related supply and demand curves
Jump to navigation
Jump to search
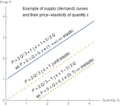
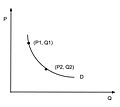
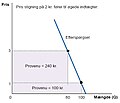
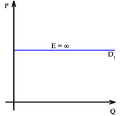
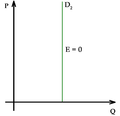
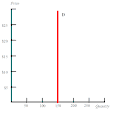
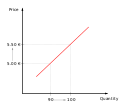
English: Supply and demand diagrams relating to the economics topic of elasticities.
Media in category "Elasticity-related supply and demand curves"
The following 85 files are in this category, out of 85 total.
-
04 elasticity scheme1.png 360 × 319; 9 KB
-
04 elasticity scheme2.png 360 × 319; 10 KB
-
04 elasticity scheme3.png 360 × 319; 33 KB
-
04 elasticity scheme4.png 360 × 319; 13 KB
-
04 perfect P-elasticity.png 438 × 456; 3 KB
-
04 perfect P-inelasticity.png 438 × 456; 3 KB
-
Arc Elasticity.jpg 442 × 394; 9 KB
-
Cross elasticity of demand complements.svg 274 × 274; 6 KB
-
Cross elasticity of demand independent.svg 274 × 274; 4 KB
-
Cross elasticity of demand substitutes xi xj.svg 512 × 516; 4 KB
-
Cross elasticity of demand substitutes.svg 274 × 274; 5 KB
-
DemandElasticity-he-2.svg 510 × 500; 35 KB
-
DemandElasticity-he.svg 510 × 500; 42 KB
-
Elasoverstraightline.jpg 513 × 476; 73 KB
-
Elastic supply with increased demand.svg 512 × 384; 49 KB
-
ElasticDemand.svg 1,052 × 744; 29 KB
-
Elasticdmd.jpg 456 × 331; 65 KB
-
Elasticidad precio.PNG 949 × 488; 30 KB
-
Elasticitetforefter.JPG 803 × 589; 41 KB
-
Elasticitetogindtægt.JPG 509 × 435; 19 KB
-
Elasticity and the Demand Curve.jpg 442 × 394; 10 KB
-
Elasticity and Two Demand Curves.jpg 442 × 394; 11 KB
-
Elasticity-elastic.png 1,023 × 991; 9 KB
-
Elasticity-inelastic.png 1,023 × 991; 9 KB
-
Elastische vraagcurve2.png 453 × 434; 3 KB
-
Elastyczność proporcjonalna.svg 644 × 712; 29 KB
-
Elastyczność sztywna.svg 644 × 712; 20 KB
-
Graf cenové citlivosti.png 776 × 486; 32 KB
-
Income elasticity of demand - inferior goods.svg 512 × 344; 2 KB
-
Inelastic Demand.jpg 960 × 720; 38 KB
-
Inelastic supply with increased demand.svg 512 × 384; 50 KB
-
InelasticDemand.svg 1,052 × 744; 29 KB
-
Inelasticdmd.jpg 432 × 304; 60 KB
-
Inelastische vraagcurve1.png 455 × 418; 3 KB
-
Ingreso total y elasticidad precio de la demanda.svg 215 × 320; 9 KB
-
Jevons-the coal question.png 874 × 589; 90 KB
-
JevonsParadoxA.png 652 × 362; 12 KB
-
JevonsParadoxB.png 652 × 362; 13 KB
-
Marshall PED.png 175 × 180; 5 KB
-
Omzetvergelijking bij prijsdaling bij een elastische vraag.png 586 × 423; 7 KB
-
Omzetvergelijking bij prijsdaling bij een inelastische vraag.png 525 × 382; 7 KB
-
Perfectly Elastic Demand.GIF 723 × 655; 5 KB
-
Perfectly Inelastic Demand.GIF 685 × 655; 7 KB
-
Popyt elastyczny.svg 644 × 712; 30 KB
-
Popyt nieelastyczny.svg 644 × 712; 22 KB
-
Preiselastizität anormal elastisch.png 960 × 720; 7 KB
-
Preiselastizität der Nachfrage - graphisch (an Funktion).png 3,037 × 2,546; 108 KB
-
Preiselastizität der Nachfrage - graphisch.png 3,037 × 2,968; 71 KB
-
Preiselastizität der Nachfrage entlang einer lineare Nachfragekurve.png 3,588 × 3,080; 388 KB
-
Preiselastizität isoelastisch.png 670 × 615; 62 KB
-
Preiselastizität proportional elastisch-no.png 686 × 620; 16 KB
-
Preiselastizität proportional elastisch.png 960 × 720; 8 KB
-
Preiselastizität sehr elastisch-no.png 671 × 608; 47 KB
-
Preiselastizität sehr elastisch.png 725 × 612; 48 KB
-
Preiselastizität sehr unelastisch-no.png 676 × 615; 13 KB
-
Preiselastizität sehr unelastisch.png 960 × 720; 7 KB
-
Preiselastizität vollkommen elastisch.png 960 × 720; 4 KB
-
Preiselastizität vollkommen unelastisch.png 960 × 720; 5 KB
-
Price elasticity - perfectly elastic.svg 750 × 700; 3 KB
-
Price elasticity - perfectly inelastic.svg 750 × 700; 3 KB
-
Price elasticity - positive PED.svg 750 × 700; 4 KB
-
Price elasticity - unit elastic.svg 750 × 700; 4 KB
-
Price elasticity - very elastic.svg 750 × 700; 4 KB
-
Price elasticity - very inelastic.svg 750 × 700; 4 KB
-
Price elasticity of demand and revenue-no.svg 229 × 341; 10 KB
-
Price elasticity of demand and revenue.png 430 × 505; 8 KB
-
Price elasticity of demand and revenue.svg 215 × 320; 9 KB
-
Price elasticity of demand.svg 235 × 220; 12 KB
-
Price elasticity of supply-cjenovna elastičnost ponude.png 630 × 566; 16 KB
-
Price elasticity of supply.PNG 471 × 193; 9 KB
-
Price elasticity over time.png 568 × 306; 7 KB
-
Substitute good chart.jpg 1,857 × 717; 166 KB
-
Test cenové citlovosti tabulka.png 806 × 211; 11 KB
-
Unit elasticity.png 1,023 × 991; 10 KB
-
Volkomen in-elastische vraagcurvecropped.png 258 × 304; 5 KB
-
Дуговая эластичность предложения.jpg 643 × 523; 29 KB
-
Дуговая эластичность спроса.jpg 635 × 525; 28 KB
-
Общая выручка и эластичность.jpg 692 × 1,016; 91 KB
-
Субституты.jpg 771 × 408; 41 KB
-
Точечная эластичность по спросу.jpg 674 × 575; 54 KB
-
Фактор времени и эластичность предложения.jpg 1,033 × 419; 75 KB
-
Эластичность кривой предложения.jpg 642 × 585; 47 KB
-
Эластичность спроса по доходу.jpg 1,011 × 474; 52 KB
-
Эластичность спроса.jpg 617 × 559; 25 KB


