Category:Economy images that should use vector graphics
Jump to navigation
Jump to search
Images composed of simple shapes, lines, and letters such as those below should be recreated using vector graphics as an SVG file. These have a number of advantages such as making it easier for subsequent editors to edit them, enabling arbitrary scaling at high quality, and sharp high-resolution renderings for print versions. See Commons:Images for cleanup for more information.
This is a subcategory of Category:Images that should use vector graphics. You can add images to this category using the template {{Convert to SVG|economy}}.
Subcategories
This category has the following 2 subcategories, out of 2 total.
Media in category "Economy images that should use vector graphics"
The following 63 files are in this category, out of 63 total.
-
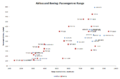 Airbus and Boeing Passengers vs Range.png 979 × 641; 31 KB
-
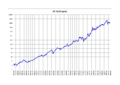 All Ordinaries.png 3,508 × 2,480; 48 KB
-
 Belgische staatsschuld.png 745 × 667; 10 KB
-
 Bkv inflacio.jpg 1,160 × 696; 63 KB
-
 Blank J-curve.jpg 327 × 323; 9 KB
-

-
 Cartographie Lien social - Performances.png 960 × 720; 44 KB
-
 Chile Lorenz Kurve 2.png 515 × 466; 16 KB
-
 CLASSIX.png 361 × 303; 2 KB
-
 Discount1.jpg 270 × 189; 23 KB
-
 Discount2.jpg 351 × 210; 22 KB
-
 DJIA2002.png 600 × 344; 10 KB
-
 Elastizitäten als Regressionsgerade.jpg 319 × 186; 16 KB
-
 Euro Currency Index.png 3,508 × 2,480; 56 KB
-
 Federal Capital Gains Tax Collections 1954-2009 history chart.pdf 2,775 × 995; 533 KB
-
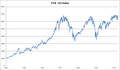 FTSE 100 index chart since 1984.png 992 × 578; 23 KB
-
 Geldmengen.jpg 907 × 646; 87 KB
-
 Gewerkschaften1887ff.PNG 968 × 602; 21 KB
-
 Graphe Dépenses et recettes publiques, France,1993-2006.png 1,154 × 736; 37 KB
-
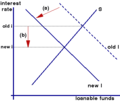
 Great Depression monetary policy.png 918 × 837; 18 KB
-
 Hard.png 976 × 631; 122 KB
-
 Historical Value of Yen.jpg 667 × 377; 40 KB
-
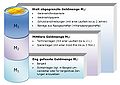
 Iceberg Model of Captitalist patriarchal Economics.png 731 × 439; 40 KB
-
 IKEA organisation.png 768 × 398; 15 KB
-
 Impact of Bush Tax Cut Extension.png 960 × 720; 65 KB
-
 Indonesian rupiah icon.png 300 × 300; 18 KB
-
 Inflation and oil.png 5,300 × 2,666; 455 KB
-
 Informalcauses.gif 592 × 330; 6 KB
-
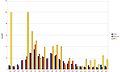
 Interest - Stacked bar chart 2006 - 2007.png 960 × 720; 62 KB
-
 J-curve.jpg 604 × 463; 25 KB
-
 Japanese unit labor costs.jpg 779 × 415; 78 KB
-
 Klassisk förklaring till arbetslöshet.gif 392 × 308; 4 KB
-
 Leerverkauf.png 742 × 514; 42 KB
-
 Licence globale.png 500 × 700; 166 KB
-
 Long-term interest rates of eurozone countries since 1993.png 1,337 × 638; 251 KB
-
 Military spending % of revenue.webp 1,556 × 346; 19 KB
-
 Money-creation.gif 397 × 539; 22 KB
-
 NASD2002.png 600 × 344; 9 KB
-
 Preissteigerung 1970-1980.png 596 × 541; 22 KB
-
 Product Hierarchy (zh-hant).jpg 1,280 × 768; 46 KB
-
 Purchasing Power of Money 3.1 .gif 403 × 96; 38 KB
-

-
 Schéma Économie Basée sur les Ressources.jpg 960 × 725; 580 KB
-
 Short (finance).png 742 × 514; 40 KB
-
 Sinus Time-Lag.jpg 1,272 × 989; 177 KB
-
 Standard Oil chart 2022.png 3,023 × 1,682; 1.67 MB
-
 Taleb and Holy Grail Distributions.png 600 × 693; 30 KB
-
 Unemployment to wages.png 1,250 × 415; 138 KB
-

-
 US Federal Outlay and GDP linear graph.png 600 × 381; 54 KB
-
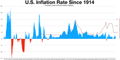
 US Inflation.png 1,200 × 800; 25 KB
-
 US Real Wages 1964-2004.gif 640 × 480; 21 KB
-
 US Unemployment 1800-1890.gif 628 × 398; 12 KB
-
-
 VAT1b2.png 407 × 128; 4 KB
-
 VAT2b22.png 442 × 159; 6 KB
-
 VAT3b22.png 537 × 175; 8 KB
-
 Vom Streidiagramm zum Elastizitätsdiagramm.jpg 843 × 735; 89 KB
-
 Wirtschaftswachstum Japan.png 804 × 361; 19 KB
-
 Zeitreihe gedlmarktzins und kundenzins.jpg 790 × 785; 104 KB
-
 Дуализм по Ранису.png 678 × 399; 22 KB
-
 Сбалансированный рост в закрытой дуалистической экономике.jpg 973 × 643; 74 KB
-
 Сбалансированный рост в открытой дуалистической экономике.jpg 973 × 643; 83 KB


.png)


.jpg)


.png)


