Category:Economic pie charts
Jump to navigation
Jump to search
Media in category "Economic pie charts"
The following 108 files are in this category, out of 108 total.
-
 2001 Numbers of Titles published in the UK.png 631 × 523; 34 KB
-
 2004 Format ml.svg 1,038 × 1,141; 4 KB
-
 2004 Format-bn.svg 1,038 × 1,161; 4 KB
-
 2004 Format-gu.svg 1,038 × 1,141; 4 KB
-
 2004 Format-hi.svg 1,038 × 1,141; 4 KB
-
 2004 Format-kn.svg 1,038 × 1,141; 3 KB
-
 2004 Format-mr.svg 1,038 × 1,141; 4 KB
-
 2004 Format-pa.svg 1,038 × 1,141; 3 KB
-
 2004 Format-ta.svg 1,038 × 1,141; 3 KB
-
 2004 Format-te.svg 1,038 × 1,141; 3 KB
-
 2004 Format.svg 1,038 × 1,141; 4 KB
-
 2004Format.jpg 211 × 231; 22 KB
-
 2008 UK Book Sales Volume.svg 1,130 × 1,006; 8 KB
-

-
 090827 Academic background 430x320.jpg 430 × 320; 27 KB
-
 Accionariat.png 846 × 566; 16 KB
-
 American-debt.jpg 526 × 443; 72 KB
-
 APEC proportion of world economic chart, 2012.png 1,200 × 659; 272 KB
-
 Arbeitnehmer Bangladesh.png 1,000 × 712; 61 KB
-
 Arbetsförmedlingens användning av budgeten 2018.png 744 × 829; 206 KB
-
 Arh emp.png 2,571 × 1,918; 282 KB
-
 Atrophy20.png 332 × 285; 7 KB
-
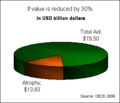 Atrophy30.png 332 × 285; 6 KB
-
 Australia trade en.png 1,157 × 549; 43 KB
-
 Australia trade.png 1,157 × 549; 24 KB
-
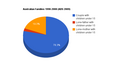 Australian Families 1998-2008 (ABS 2009).png 600 × 371; 14 KB
-
 Bell telephone magazine (1922) (14570129269).jpg 1,406 × 988; 326 KB
-
 Bell telephone magazine (1922) (14755858532).jpg 1,284 × 910; 275 KB
-
 Bild-Leser nach Geschlecht.svg 550 × 420; 7 KB
-
 Bild-Leser nach Schulabschluss.svg 550 × 445; 9 KB
-
 Bruttoinlandsprodukt Deutschland - Verwendung 2013.svg 832 × 496; 31 KB
-
 Bundeshaushaltsplan 2008.png 855 × 472; 82 KB
-
 CAPspendingbysector.png 611 × 382; 24 KB
-
 CCDT-NS3.JPG 914 × 581; 38 KB
-
 Charts (2).png 799 × 432; 29 KB
-
 Cryptocurrency-market-capitalizations-2017-12-13.jpg 1,243 × 875; 72 KB
-
 DAX Gewichtung 10 20061103.svg 622 × 543; 62 KB
-
 DAX Gewichtung.png 612 × 543; 10 KB
-
 Daxingganlingecon.png 100 × 100; 2 KB
-
 DCSDRevenue.JPG 724 × 451; 163 KB
-
 Detriotecon.jpg 539 × 317; 30 KB
-
 Disposition of US Natural Gas 2014.png 2,719 × 2,107; 115 KB
-

-
 Distribution of Detroit's Economy.svg 290 × 290; 10 KB
-
 Distribution of two plus income households.svg 886 × 709; 3 KB
-
 Entstehung des BIP.svg 1,181 × 708; 6 KB
-
 ESt D Kreisdiagramm Steuerarten und Einnahmen 2021.svg 1,440 × 900; 140 KB
-
 ESt D Kreisdiagramm Steuereinnahmen nach Verteilung 2021.svg 1,440 × 900; 119 KB
-
 Evolución del mercado.png 899 × 772; 126 KB
-
 Female occ 1881.jpg 1,161 × 601; 33 KB
-

-
 Financement participatif économie France 2018 selon KPMG.jpg 1,646 × 1,328; 286 KB
-
 Fotopm4.jpg 1,061 × 644; 103 KB
-
 France-assurance-vieillesse-regimes.svg 600 × 450; 37 KB
-
 FSANetCost2006.png 786 × 414; 70 KB
-
 FY13 Shareholder.jpg 675 × 443; 53 KB
-
 FY13 주주구성.jpg 635 × 437; 53 KB
-
 Gelatin Production by Geography.svg 322 × 229; 48 KB
-
 Global Distribution of Wealth.jpeg 2,000 × 1,655; 132 KB
-

-

-
 Ipcc 2014 01.svg 600 × 400; 9 KB
-
 Ipcc 2014 02.png 1,200 × 800; 90 KB
-
 Länderaufteilung Photovoltaik Global 30.JPG 530 × 345; 22 KB
-
 Marktaandeel zorgverzekeraars.JPG 514 × 392; 30 KB
-
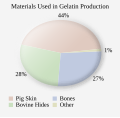 Materials Used in Gelatin Production.svg 342 × 334; 3 KB
-
 Mt sectors gdp cs.png 398 × 344; 2 KB
-
 Mt sectors occupation cs.png 397 × 376; 2 KB
-
 NDB-Chart-BRICS.png 1,058 × 962; 174 KB
-
 New Zealand Revenue 2005-06.png 333 × 370; 12 KB
-
 New Zealand Revenue 2005-06v2.png 579 × 454; 18 KB
-
 New Zealand tax revenue 2013-14.png 672 × 477; 20 KB
-
 Odisha Budget Expenditure 2014 15.png 721 × 483; 44 KB
-
 Operatorzy sieci komórkowych w Hiszpanii wykres.jpg 512 × 384; 17 KB
-
 Origine de la gélatine.svg 294 × 218; 6 KB
-
 Participación de mercado de las farmacias chilenas, 2007.svg 500 × 600; 202 KB
-
 Paticipacaonopibmercosul.svg 570 × 490; 9 KB
-
 PIB Floride.svg 1,242 × 660; 206 KB
-
 Polyurethane.gif 651 × 316; 7 KB
-
 Prijsopbouw benzine.PNG 350 × 237; 4 KB
-
 Producción carbón 2007-en.png 672 × 564; 27 KB
-
 Producenci Kakao.jpg 721 × 421; 28 KB
-
 Puerto-rico-gdp-by-sector.png 1,560 × 1,560; 281 KB
-
 PV-Global-2010.svg 534 × 361; 32 KB
-
 Sector-focused structure of Gross Domestic Product in 2008.JPG 529 × 300; 21 KB
-

-
 Sources of electricity by InstalledCapacity 2013.png 675 × 428; 43 KB
-

-
 Stückzahlen Transaktionsdruck.PNG 596 × 299; 21 KB
-
 The price of coffee 2.jpg 1,200 × 1,024; 131 KB
-
 The price of coffee.jpg 1,600 × 1,200; 216 KB
-
 TiedAid.png 465 × 226; 19 KB
-
 Trabajadores.jpg 962 × 293; 39 KB
-
 U.S. Federal Receipts - FY 2007.png 960 × 720; 92 KB
-
 U.S. Federal Spending - FY 2006.png 960 × 720; 22 KB
-
 Utländskt ägande USAs statsskuld.jpg 527 × 400; 31 KB
-
 VerteilungVolkseinkommen.svg 980 × 1,086; 3 KB
-
 Vertrieb Rena Lange.jpg 1,521 × 729; 32 KB
-
 Verwendung des BIP.svg 546 × 339; 30 KB
-
 Voucher privatization in Czechoslovakia Graf Undertakings.png 383 × 200; 37 KB
-

-
 Weltmarkt Windkraftanlagenhersteller 2010.png 823 × 579; 73 KB
-
 WeltmarktanteileAromenRiechstoffe 2010.svg 856 × 856; 3 KB
-
 World Economy languages.png 1,200 × 800; 202 KB
-
 World gdp 2012 see description.png 650 × 500; 17 KB
-
 WORLD RENEWABLE ENERGY DISTRIBUTION.png 640 × 303; 104 KB
-
 World Uranium Mining Production 2012-ar.png 1,266 × 1,081; 173 KB
-
 World Uranium Mining Production 2012.png 486 × 415; 21 KB


_nach_Wirtschaftszweigen.png)


.png)
_(14570129269).jpg)
_(14755858532).jpg)


.png)


_by_EU_member_country.png)


,_Fiscal_Year_2013_(15773254074).jpg)


_NL.svg)
.svg)


.png)


