Category:Economic maps of Paris
Jump to navigation
Jump to search
Departments of Metropolitan France: Bouches-du-Rhône [13] · Calvados [14] · Charente [16] · Gard [30] · Hérault [34] · Indre-et-Loire [37] · Meurthe-et-Moselle [54] · Pyrénées-Orientales [66] · Haut-Rhin [68] · Haute-Saône [70] · Saône-et-Loire [71] · Sarthe [72] · Paris [75] · Yvelines [78] · Tarn [81] · Territoire de Belfort [90]
Subcategories
This category has only the following subcategory.
R
- Real estate price maps of Paris (60 F)
Media in category "Economic maps of Paris"
The following 21 files are in this category, out of 21 total.
-

-
 Boucheries du Moyen Âge au 18e siècle - ALPAGE.pdf 1,691 × 1,143; 790 KB
-
 Boucheries du Moyen Âge au 18e siècle - ALPAGE.svg 812 × 549; 756 KB
-
 Boucheries et la distance à l'eau au 15e siècle - ALPAGE.pdf 1,752 × 1,239; 289 KB
-
 Carte des anciennes carrières de Paris.png 684 × 519; 1,010 KB
-
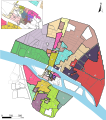 Carte des paroisses fiscales en 1300 - ALPAGE.svg 503 × 569; 1.06 MB
-
 Carte du taux de logements vacants dans Paris intramuros en 2009.jpg 752 × 340; 56 KB
-
 Carte industrielle de la région parisienne, 1927 - Bibliothèques spécialisées Paris.jpg 4,617 × 4,224; 4.1 MB
-
-
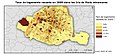
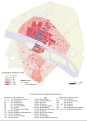
 Densité de feux des contribuables sur Paris vers 1300.svg 549 × 781; 1.06 MB
-

-
 Hiérarchie des boucheries au 15e siècle - ALPAGE.pdf 1,752 × 1,239; 282 KB
-
 Hiérarchie des boucheries en 1714 - ALPAGE.pdf 1,752 × 1,239; 283 KB
-
 IDF emp2 INSEE 2012 jms.png 4,538 × 4,048; 4.84 MB
-
 Les hôtels à Paris vers 1300.svg 492 × 581; 401 KB
-
 Les hôtels à Paris vers 1400.svg 511 × 610; 596 KB
-
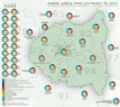 PA INSEE 2012 jms.png 4,538 × 4,048; 5.2 MB
-
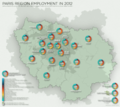
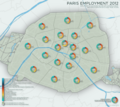
 Paris emploi 2015 jms.png 4,538 × 4,048; 5.6 MB
-
 Paris INSEE employment 2012 jms.png 4,538 × 4,048; 3.94 MB
-
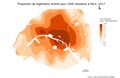 Proportion des logements Airbnb pour 1000 habitants à Paris, 2017.pdf 1,914 × 1,247; 553 KB
-
 Revenu fiscal médian par unité de consommation en 2001 - Paris.svg 1,320 × 730; 61 KB


