Category:Economic charts of Tunisia
Jump to navigation
Jump to search
Subcategories
This category has only the following subcategory.
U
Media in category "Economic charts of Tunisia"
The following 23 files are in this category, out of 23 total.
-
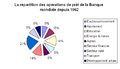 BanqueTun.PNG 514 × 295; 11 KB
-
 Ecole primaire Riadh Zonef Mannouba WikiChallenge 2022 01.jpg 342 × 238; 17 KB
-
 Ecole primaire Riadh Zonef Mannouba WikiChallenge 2022 03.jpg 336 × 225; 13 KB
-
 Evolution du revenu annuel par habitant - Tunisie - ar.jpg 715 × 354; 41 KB
-
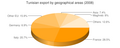 Export Tunisia 2008.png 500 × 200; 22 KB
-
 Exportations Tunisie 2005.PNG 528 × 399; 15 KB
-
 GDP per capita development of Tunisia.svg 850 × 600; 31 KB
-
 GDP PIB tunisia.svg 630 × 630; 35 KB
-
 GDPcurrent.svg 630 × 630; 37 KB
-
 IDE tunisie.PNG 800 × 477; 6 KB
-
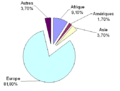
 Importation 2005.PNG 519 × 384; 9 KB
-
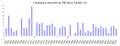
 Population Active Kasserine.png 600 × 390; 24 KB
-
 Rent Maghreb.png 776 × 650; 16 KB
-
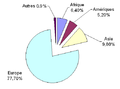
 Tunisia Export Treemap.png 961 × 751; 237 KB
-
 Tunisia Exports Treemap 2017.svg 900 × 900; 462 KB
-
 Tunisia Import 2008.png 500 × 200; 22 KB
-
 Tunisia-phone.png 786 × 407; 14 KB
-
 Tunisie - Entreprises étrangères graphique 2001-2007-fr.svg 700 × 415; 28 KB
-
 Tunisie - Entreprises étrangères graphique 2001-2010-fr.svg 609 × 413; 24 KB
-
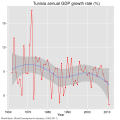
 Tunisie croissance du PIB.jpg 453 × 199; 62 KB
-
 Tunisie PIB 1962-2005.svg 3,989 × 1,497; 68 KB
-
 Tunisie PIB 1962-2017.svg 868 × 485; 42 KB
-
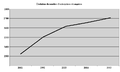
 Évolution du nombre d'entreprises étrangères Tunisie.gif 618 × 342; 9 KB


