Category:Economic block diagrams
Jump to navigation
Jump to search
Media in category "Economic block diagrams"
The following 106 files are in this category, out of 106 total.
-
 Ablaufarten Mensch2.svg 567 × 371; 253 KB
-
 Activity-based Costing.jpg 567 × 455; 45 KB
-
 Activity-based Costing.png 567 × 455; 3 KB
-
 Agribusiness Chain.png 956 × 684; 22 KB
-
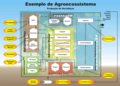 Agroecossistemas.png 1,024 × 730; 127 KB
-
 Arbeitsinhaltsveränderung.svg 800 × 600; 12 KB
-
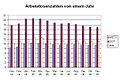 Arbeitslose 2005-11-d.jpg 618 × 410; 44 KB
-
 Arbeitslose 2005-11.jpg 657 × 410; 45 KB
-
 Arbeitsmarkt gliederung.jpg 340 × 185; 10 KB
-
 B-pack P2P cycle.png 1,192 × 919; 121 KB
-
 B-pack P2P cycle2.png 318 × 268; 37 KB
-
 Balanço Funcional.PNG 653 × 335; 24 KB
-
 Bank Rate2.svg 500 × 1,000; 4 KB
-
 Benefits Chain Diagram.png 853 × 609; 68 KB
-
 BenefitsChain Of Volunteer Tracking.png 853 × 609; 249 KB
-
 BizCore struttura ideale.png 243 × 250; 10 KB
-
 BizCore struttura reale.png 296 × 296; 10 KB
-
 BizCore struttura tecnologica configurata navigazione.png 734 × 484; 42 KB
-
 BizCore struttura tecnologica configurata.png 717 × 422; 27 KB
-
 BizCore struttura tecnologica.png 381 × 435; 20 KB
-
 Cadeia de abastecimento.jpg 619 × 212; 16 KB
-
 Capitalism.jpg 487 × 178; 17 KB
-
 CbrCycle basic de.png 1,200 × 986; 28 KB
-
 CDS-default.PNG 628 × 477; 13 KB
-
 CDS-nodefault.PNG 628 × 477; 13 KB
-
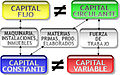 Cfij-Ccir-Ccon-Cvar.jpg 431 × 270; 44 KB
-
 Ciclo grande depressao.png 362 × 286; 16 KB
-
 Cinco Forças de Porter.png 800 × 693; 97 KB
-
 Circuito economico basico.png 1,193 × 512; 19 KB
-
 Circul6.png 1,904 × 1,108; 32 KB
-
 Company Cash Cycle.jpg 449 × 258; 42 KB
-
 Composicion Credito hipotecario Capital Intereses.png 969 × 636; 29 KB
-
 Corporate Responsibility.png 720 × 540; 25 KB
-
 Coste de un credito hipotecario capital principal gastos intereses.png 1,023 × 670; 33 KB
-
 Costo Total Credito Prestamo Hipoteca Capital Gastos Intereses.png 957 × 698; 75 KB
-
 Cours action Dexia du 1er janvier 2009 au 27 février 2009.png 1,225 × 460; 23 KB
-
 Cours action Dexia du 9 septembre 2008 au 25 février 2009.png 1,022 × 523; 29 KB
-
 Cours petrole 2008.png 1,209 × 475; 54 KB
-
 Cours petrole 2009 02 15.png 1,155 × 417; 59 KB
-

-
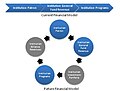 CWF Financial Model.jpg 516 × 392; 19 KB
-
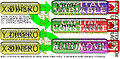 D-M-D'.jpg 1,160 × 570; 267 KB
-

-
 Dassault Aviation Organigram (2012)-fr.svg 800 × 580; 53 KB
-
 Defense-offset-gen-example-it.jpg 1,056 × 816; 57 KB
-
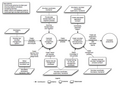
 DiagFuncMacroSyst.pdf 1,239 × 1,752; 69 KB
-
 Diagram of equal opportunity formal model.png 900 × 500; 214 KB
-
 Diagram of equal opportunity substantive model.jpg 900 × 500; 284 KB
-
 Different-Types-of-Trade.png 749 × 920; 19 KB
-
 Division du travail et croissance new.png 250 × 249; 10 KB
-
 Division du travail et croissance.png 805 × 800; 49 KB
-
 Division du travail et croissance.svg 365 × 363; 118 KB
-
 División del trabajo y crecimiento según Adam Smith.svg 365 × 363; 99 KB
-
 DMT DRS.JPG 606 × 568; 40 KB
-
 Dokumenteninkasso.pdf 1,754 × 1,239; 26 KB
-
 Downstream-integration.png 2,363 × 617; 64 KB
-
 Eco.png 1,172 × 1,063; 111 KB
-
 Eff-transactie.png 676 × 172; 3 KB
-
 Exchange Rate Regimes.png 928 × 503; 26 KB
-
 ExportLandModel illustration.png 1,076 × 312; 38 KB
-
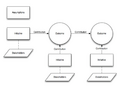
 Flow diagram.jpg 257 × 268; 34 KB
-
 Flow of Funds.svg 703 × 443; 5 KB
-
 Flussgrößen des Arbeitsmarktes nach Mortensen 1970.PNG 901 × 406; 28 KB
-
 Fondo de maniobra.svg 329 × 269; 37 KB
-
 Functions-database.png 1,771 × 1,079; 44 KB
-
 GrafikLeitzins.jpg 1,991 × 1,022; 144 KB
-

-

-
 Individual Demand and Market Demand.png 585 × 556; 26 KB
-
 International-control.png 1,500 × 925; 50 KB
-
 Mediaconglomeraten.png 700 × 640; 59 KB
-
 Microecon model.jpeg 500 × 252; 27 KB
-
 Model uppsala.jpg 1,941 × 544; 99 KB
-
 Net-Income.jpg 380 × 209; 21 KB
-
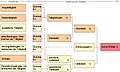
 Oeffentliche Finanzen.png 793 × 1,123; 62 KB
-
 People-in-ICS.png 1,883 × 1,133; 39 KB
-
 SPC model UK.jpg 850 × 2,279; 221 KB
-
 Standardisierungsproblem 3 - 2 Knoten standardisiert.png 301 × 281; 5 KB
-
 Standardisierungsproblem 4 - 3 Knoten standardisiert.png 305 × 288; 5 KB
-
 Strategien der Geldpolitik.svg 707 × 227; 110 KB
-
 Structure of world economy.jpg 900 × 1,500; 115 KB
-
 Subprime Crisis Diagram - X1 zh-hant.svg 960 × 720; 50 KB
-
 Swap.png 1,200 × 181; 30 KB
-
 Systematik holzwirtschaft neu.jpg 1,443 × 783; 300 KB
-
 Systematik holzwirtschaft.jpg 470 × 287; 36 KB
-
-

-
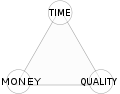
 Time-Quality-Money.png 361 × 280; 20 KB
-
 Time-Quality-Money.svg 385 × 300; 4 KB
-
 Tuotantoketju.png 708 × 122; 6 KB
-
 Umweltmerkmale-Wahrnehmungsmodel.png 1,130 × 591; 78 KB
-
 Uncovered-interest-arbitrage.svg 465 × 227; 165 KB
-
 Uncovered-interest-rate-parity.svg 465 × 227; 162 KB
-
 Valor Recuperablejoe villagran.jpg 1,450 × 594; 79 KB
-
 Value-chain-map-organic-cotton.png 2,329 × 1,700; 80 KB
-
 Wikipedia peats-de-grafik-Unternehmen.png 2,042 × 1,133; 36 KB
-
 Wirtschaftseinheiten Betriebe.svg 668 × 263; 7 KB
-
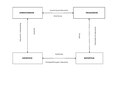
 Wirtschaftseinheiten blank.svg 668 × 263; 7 KB
-
 Wirtschaftseinheiten Verwaltungen.svg 668 × 263; 7 KB
-
 Wirtschaftseinheiten Öffentliche Haushalte.svg 668 × 263; 7 KB
-
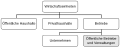
 Wirtschaftseinheiten.svg 668 × 263; 7 KB
-
 Zeit je Einheit.jpg 978 × 584; 133 KB
-
 Активы.jpg 615 × 296; 26 KB
-
 Основні течії сучасної економічної думки.svg 524 × 372; 42 KB
-
 Система виробничих відносин Workaround.svg 524 × 372; 13 KB
-
 Система виробничих відносин.svg 524 × 372; 58 KB


-fr.svg)


