Category:Donut charts
Jump to navigation
Jump to search
| Upload media | |||||
| Subclass of | |||||
|---|---|---|---|---|---|
| |||||
Media in category "Donut charts"
The following 86 files are in this category, out of 86 total.
-
20231030 Digital media business model.svg 800 × 800; 2 KB
-
Actionnariat cnt.png 1,246 × 624; 37 KB
-
Admin-community-demographics 2018.png 512 × 312; 21 KB
-
AKKA Technologies 2015 Repartition par zones geographiques.png 588 × 372; 61 KB
-
APEC proportion of world economic chart, 2012.png 1,200 × 659; 272 KB
-
Atlantic Grupa sales profit by markets.jpg 818 × 579; 52 KB
-
Azionariato.jpg 560 × 238; 47 KB
-
Breitband-Internet in Deutschland 2019.svg 600 × 200; 53 KB
-
Causes of outages 2.png 714 × 515; 124 KB
-
Chart it77.png 558 × 333; 11 KB
-
Christianity.jpg 566 × 355; 33 KB
-
Circle graph of Population in Tokyo Special Wards.svg 256 × 256; 5 KB
-
Commons app active installs by country.png 1,151 × 979; 93 KB
-
Consumer Expenditures (Per Person in the United States).png 1,834 × 1,118; 327 KB
-
Corporations.png 557 × 291; 16 KB
-
Diagramme en anneau.png 1,200 × 1,177; 228 KB
-
Doc123.pdf 1,752 × 1,239; 244 KB
-
Donut-Chart.svg 360 × 360; 8 KB
-
Donut.png 450 × 334; 52 KB
-
Doughnut shape Pie Chart.jpg 1,458 × 905; 95 KB
-
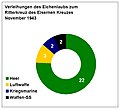
Eichenlaub November 1943.jpg 663 × 601; 66 KB
-
EleccionesGeneralesEspanya2011 participacion.png 776 × 506; 87 KB
-
Election sud-africaine (2009).jpg 794 × 1,123; 82 KB
-
ESt D Kreisdiagramm Steuerarten und Einnahmen 2021.svg 1,440 × 900; 140 KB
-
ESt D Kreisdiagramm Steuereinnahmen nach Verteilung 2021.svg 1,440 × 900; 119 KB
-
ESTATU BATUETAN KONTSUMITZEN DIREN GENEROEN PORTSENTAIAK.pdf 1,112 × 1,356; 824 KB
-
Etiki donut diagram.svg 512 × 481; 19 KB
-
Example of a doughnut chart.png 1,768 × 1,215; 181 KB
-
File 衆議院 2021年10月1日時点での各党の議席数(修正版).png 876 × 831; 85 KB
-
Forexcorporate (en).pdf 1,752 × 1,239; 169 KB
-
FWC26 bid.png 629 × 419; 43 KB
-
FXCP123.pdf 1,752 × 1,239; 165 KB
-
GAC-NIO Hycan Ownership.png 374 × 373; 19 KB
-
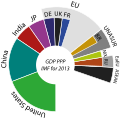
GDP PPP 2013 Selection DE.svg 512 × 509; 22 KB
-
GDP PPP 2013 Selection EN.svg 512 × 509; 21 KB
-
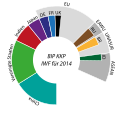
GDP PPP 2014 Selection DE.svg 512 × 512; 55 KB
-
GDP PPP 2014 Selection EN.svg 512 × 512; 55 KB
-
GDP PPP 2016 Selection DE.svg 512 × 512; 94 KB
-
GDP PPP 2016 Selection EN.svg 512 × 512; 94 KB
-
GDP PPP 2017 Selection.svg 512 × 512; 44 KB
-
GDP PPP 2018 Selection.svg 512 × 512; 73 KB
-
GDP PPP 2021 Selection.svg 512 × 445; 49 KB
-
Global average human diet and protein composition and usage of crop-based products.webp 2,117 × 1,598; 176 KB
-
Global GHG Emissions by Sector 2016.png 1,740 × 1,305; 231 KB
-
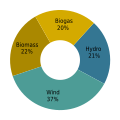
Graph RE Australia 2010.svg 600 × 600; 16 KB
-
Graph RE UK mix.svg 600 × 600; 16 KB
-
Graph Romania electricity supply mix 2010.svg 600 × 600; 16 KB
-
I91 Tor Diagram.PNG 1,036 × 911; 140 KB
-
Illustration de cette théorie économique.png 993 × 993; 317 KB
-
Illustration théorie du donut.svg 744 × 1,052; 1.04 MB
-
Kingdome usage, 1980 (32523178267).jpg 2,550 × 3,300; 839 KB
-
Males who force women to have sex.PNG 602 × 478; 22 KB
-
Med-PaLM M data mixture overview.png 1,904 × 1,185; 283 KB
-
MultiMedBench overview, a benchmark that covers 14 different biomedical tasks.png 1,914 × 1,447; 370 KB
-
Overall GHG from Transport.png 4,268 × 4,267; 1.85 MB
-
People Wikidata Items without images.png 836 × 371; 19 KB
-
Pie chart of cancer incidences.png 424 × 284; 26 KB
-
Portuguese Overshoot Doughnut.jpg 9,992 × 8,417; 1.58 MB
-
Prihodi Atlantic Grupe po tržištima.jpg 1,212 × 700; 212 KB
-
Prihodi od prodaje po tržištima 2014 hr.png 882 × 601; 174 KB
-
RE Germany 2009 pie chart.svg 600 × 600; 16 KB
-
Religious diversity in India.png 389 × 297; 8 KB
-
Results of Spanish election 2011.png 506 × 505; 37 KB
-
Revenue BMBG 2015.jpg 808 × 776; 183 KB
-
Réserves prouvées de gaz naturel en 2005.jpg 570 × 560; 129 KB
-
Seat Allocation 2007.jpg 530 × 660; 110 KB
-
Sparql-result-format-donut.png 1,031 × 502; 50 KB
-
Statystyka na 5 urodziny Wikibooks- Najbardziej rozbudowane podręczniki.png 1,122 × 688; 158 KB
-
Steuereinnnahmen overlay1.jpg 943 × 464; 28 KB
-
TOILET MEAL SOCIAL RESERCH.jpg 540 × 764; 73 KB
-
Turun kaupunginvaltuusto paikkajako 2005-2008.jpg 571 × 424; 112 KB
-
Unique words in Russian dictionaries 2015.png 3,286 × 3,000; 768 KB
-
Vega-piechart.png 683 × 553; 41 KB
-
Wahlergebnis Ungarn 2006.PNG 1,175 × 867; 47 KB
-
Webebb logo.svg 512 × 161; 130 KB
-
Wikidata Items without images.png 836 × 371; 19 KB
-
Women murdered in Italy in 2022.svg 512 × 288; 33 KB
-
衆議院 2021年10月1日時点での各党の議席数.png 876 × 831; 81 KB


