Category:Diagrams about the COVID-19 pandemic in the United States
Jump to navigation
Jump to search
Countries of the Americas: Antigua and Barbuda · Argentina · The Bahamas · Barbados · Belize · Bolivia · Brazil · Canada · Chile · Colombia · Costa Rica · Cuba · Dominica · Dominican Republic · Ecuador · El Salvador · Grenada · Guatemala · Guyana · Haiti · Honduras · Jamaica · Mexico · Nicaragua · Panama · Paraguay · Peru · Saint Kitts and Nevis · Saint Lucia · Saint Vincent and the Grenadines · Suriname · Trinidad and Tobago · United States of America · Uruguay · Venezuela
Other areas: Aruba · Bermuda · Curaçao · French Guiana · Greenland · Guadeloupe · Martinique · Puerto Rico
Other areas: Aruba · Bermuda · Curaçao · French Guiana · Greenland · Guadeloupe · Martinique · Puerto Rico
Subcategories
This category has only the following subcategory.
C
Media in category "Diagrams about the COVID-19 pandemic in the United States"
The following 75 files are in this category, out of 75 total.
-
 20200401 Trump coronavirus quote timelines - Washington Post.svg 1,648 × 927; 374 KB
-
 20200806 Trump coronavirus quote timeline II - The Guardian.svg 1,648 × 927; 318 KB
-
 50 state increases in covid-19 cases 05-Jul.png 3,034 × 3,547; 602 KB
-
 50 state increases in covid-19 cases 12-Jul.png 3,034 × 3,547; 643 KB
-
 50 state increases in covid-19 cases 19-Jul.png 3,034 × 3,547; 641 KB
-
 50 state increases in covid-19 cases 21-Jun.png 3,034 × 3,547; 573 KB
-
 50 state increases in covid-19 cases 28-Jun.png 3,034 × 3,547; 619 KB
-
 50 state increases in covid-19 cases.png 3,034 × 3,532; 526 KB
-
 Colorado USA New Cases of Corona Virus (updated 4-2-2020).png 600 × 371; 22 KB
-
 Comparativo nº abs vs rel.jpg 757 × 163; 45 KB
-
 Corona-2020-03-25.png 2,937 × 1,861; 267 KB
-
 Corona.png 2,737 × 1,743; 246 KB
-
 Coronavirus deaths.png 2,935 × 1,761; 281 KB
-
 Coronavirus-Maryland-May-1.jpg 768 × 591; 112 KB
-
 Covid cases and deaths UK US.svg 806 × 740; 125 KB
-
 Covid cases million.jpg 1,579 × 660; 72 KB
-
 Covid cases vs rate - USA.png 1,360 × 854; 105 KB
-
 Covid cases.png 1,541 × 857; 188 KB
-
 COVID Confirmed Cases and Deaths US.png 2,000 × 1,500; 84 KB
-
 COVID Confirmed Cases US.png 2,000 × 1,500; 68 KB
-
 Covid daily deaths.webp 1,567 × 716; 97 KB
-
 COVID Deaths US.png 2,000 × 1,500; 62 KB
-
 Covid deaths.jpg 1,547 × 658; 97 KB
-
 Covid evolution-usa.svg 1,063 × 709; 56 KB
-
 COVID Recovered US.png 2,000 × 1,500; 56 KB
-
 Covid-19 cases by country July 2020 01.jpg 630 × 630; 68 KB
-
 Covid-19 cases in the United States March to July 2020.jpg 630 × 630; 64 KB
-
 COVID-19 cases per 100 000 population in South America.png 791 × 565; 60 KB
-
 Covid-19 cases per 100,000 population, US and EU.jpg 560 × 387; 53 KB
-
 Covid-19 deaths per 100,000 population, US and EU.jpg 563 × 370; 53 KB
-
-
 CoViD-19 US.svg 702 × 524; 78 KB
-

-

-
 COVID-19-United States-log.svg 576 × 432; 97 KB
-
 COVID-19-United States.svg 540 × 405; 44 KB
-
 Covid19-confirmedcases 2020-07-02-1.png 1,919 × 1,041; 599 KB
-
 Dados Covid Estados Unidos 4 dez 2020.jpg 885 × 550; 52 KB
-
 Daily CoViD US.svg 886 × 531; 25 KB
-

-

-

-
 EvolutionCoVid19UnitedStates.png 816 × 604; 79 KB
-
 Excess mortality during coronavirus pandemic, through April 11.png 2,142 × 952; 219 KB
-
 Hotel ACS Layout.png 1,190 × 508; 545 KB
-
 Lab-data-graph.png 960 × 573; 15 KB
-
 LogEvolCovid-19USA.svg 625 × 453; 320 KB
-
 Massachusetts COVID-19 cases by age group.svg 588 × 365; 142 KB
-
 Massachusetts COVID-19 cases by exposure.svg 602 × 372; 142 KB
-
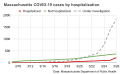 Massachusetts COVID-19 cases by hospitalization.svg 600 × 371; 138 KB
-
 Massachusetts COVID-19 cases by percent hospitalized.svg 678 × 371; 132 KB
-
 Massachusetts COVID-19 cases by sex.svg 593 × 366; 85 KB
-
 Massachusetts COVID-19 Deaths by Age Group.svg 588 × 365; 115 KB
-
 Massachusetts COVID-19 tests by laboratory total patients tested.svg 972 × 734; 520 KB
-
 Massachusetts COVID-19 total cases.svg 624 × 365; 117 KB
-
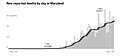 Mddeathsmay1.jpg 670 × 314; 57 KB
-
 National-Forecast-Incident-Cumulative-Deaths-2020-07-27.jpg 2,560 × 1,280; 344 KB
-
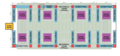 Open ACS Layout.png 1,100 × 514; 632 KB
-
 Oregon COVID-19 trands chart.png 1,046 × 359; 59 KB
-
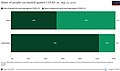 Pessoas vacinadas 25 ago 2021.jpg 937 × 551; 71 KB
-
 Sd nd.svg 495 × 360; 127 KB
-

-
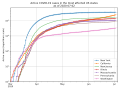 Time series of active COVID-19 cases, most affected US states.svg 768 × 576; 63 KB
-
 Trajectoire épidémie covid-19.png 3,330 × 2,220; 207 KB
-
 Tribal-support.pdf 1,275 × 1,650; 125 KB
-
 U.S. COVID-19 Deaths Could Be Far Higher Than Reported.jpg 1,199 × 564; 211 KB
-
 United States tests for SARS CoV-2 - May 11, 2020.jpg 1,280 × 720; 96 KB
-
 US-QE-COVID19.png 1,392 × 774; 32 KB
-
 Us-state-trends(1).png 1,653 × 790; 158 KB
-
 Us-state-trends.png 1,581 × 815; 162 KB
-
 Weekly new hospitalizations in Denmark, USA and Israel in Omicron wave.png 3,400 × 2,400; 552 KB
-
 WHO Covid 2020 Jan-Aug daily C USA.pdf 3,300 × 1,950; 26 KB
-
 WHO Covid C USA.pdf 3,300 × 1,950; 18 KB
-
 WHO Covid rn confirmed,deaths Region of the Americas07.pdf 3,300 × 1,950; 29 KB
-
 Wuhan virus trajectory by state, as of March 25, 2020.jpg 2,048 × 1,239; 110 KB


.png)


_-_Infizierte_(800px).svg)
_-_Tote_(800px).svg)


.jpg)
.jpg)


.png)


