Category:Diagrams about the COVID-19 pandemic in Germany
Jump to navigation
Jump to search
overview about the statistics of the COVID-19 pandemic in Germany | |||||
| Upload media | |||||
| Instance of |
| ||||
|---|---|---|---|---|---|
| Part of | |||||
| Location |
| ||||
| Has part(s) | |||||
| |||||
Subcategories
This category has only the following subcategory.
Media in category "Diagrams about the COVID-19 pandemic in Germany"
The following 15 files are in this category, out of 15 total.
-
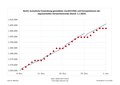 Entwicklung der Covid-19 Fälle in Berlin.pdf 1,752 × 1,239; 404 KB
-
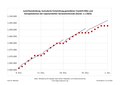 Entwicklung der Covid-19 Fälle in Brandenburg.pdf 1,752 × 1,239; 411 KB
-
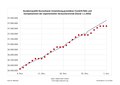 Entwicklung der Covid-19 Fälle in Deutschland.pdf 1,752 × 1,239; 405 KB
-
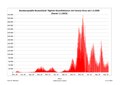
 Entwicklung der täglichen Neuinfektionen mit dem Corona-Virus im Land Berlin.pdf 1,752 × 1,239; 414 KB
-
 Entwicklung der täglichen Neuinfektionen mit dem Corona-Virus im Land Brandenburg.pdf 1,752 × 1,239; 425 KB
-
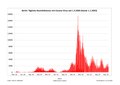
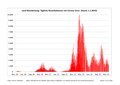
 Entwicklung der täglichen Neuinfektionen mit dem Corona-Virus in Deutschland.pdf 1,752 × 1,239; 416 KB
-
 Corona Zahlen Deutschland.png 560 × 420; 16 KB
-
 Corona-Fallzahlen.png 2,360 × 1,275; 241 KB
-
 Corona-Infizierte Deutschland.gif 709 × 529; 519 KB
-
 COVID-19-Germany-log.svg 540 × 405; 89 KB
-
 COVID-19-Germany.svg 540 × 405; 46 KB
-
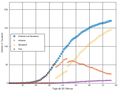
 COVID-19-Pandemie - DE (Deutschland) - Infizierte (800px).svg 800 × 450; 477 KB
-
 COVID-19-Pandemie - DE (Deutschland) - Tote (800px).svg 800 × 450; 472 KB
-
 R-Werte 2.png 1,889 × 944; 36 KB
-
 R-Werte 3.png 1,803 × 1,140; 52 KB


_-_Infizierte_(800px).svg)
_-_Tote_(800px).svg)

