Category:Diagrams about the COVID-19 pandemic in China
Jump to navigation
Jump to search
Subcategories
This category has the following 2 subcategories, out of 2 total.
Media in category "Diagrams about the COVID-19 pandemic in China"
The following 76 files are in this category, out of 76 total.
-
 2019-coronavirus-china-2020-01-21.png 2,724 × 2,600; 267 KB
-
 2019-nCoV in China.svg 512 × 410; 63 KB
-
 2019-nCov-1-20200225.svg 512 × 640; 7.36 MB
-
 2019-nCoV中国疫情统计2020-01-22.png 3,083 × 2,145; 382 KB
-
 2020 coronavirus cases by date of report.svg 988 × 648; 118 KB
-
 2020 coronavirus outbreak in China.svg 659 × 366; 106 KB
-
 2020 coronavirus patients in China.svg 988 × 638; 209 KB
-
 2020 coronavirus quarantine in China.svg 659 × 429; 40 KB
-

-
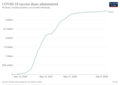 Chart of COVID-19 vaccine doses administered in Mainland China.png 3,400 × 2,400; 343 KB
-

-

-
-
 Corona-2020-03-25.png 2,937 × 1,861; 267 KB
-
 Corona.png 2,737 × 1,743; 246 KB
-
 Coronavirus deaths.png 2,935 × 1,761; 281 KB
-
 Covid 19 new cases and deaths China showing Hubei lockdown.png 1,166 × 656; 103 KB
-
 Covid cases vs rate - CHINA.png 1,366 × 852; 159 KB
-
 COVID Confirmed Cases and Deaths China.png 2,000 × 1,500; 88 KB
-
 COVID Confirmed Cases China.png 2,000 × 1,500; 89 KB
-
 COVID Deaths China.png 2,000 × 1,500; 74 KB
-
 COVID Recovered China.png 2,000 × 1,500; 75 KB
-
 Covid subepidemic model.png 1,857 × 1,050; 616 KB
-
 COVID-19 Ages stat RU.webp 1,300 × 1,134; 66 KB
-
 CoViD-19 CN.svg 705 × 528; 32 KB
-
 COVID-19 in China 2020 to April 20, 2022.jpg 538 × 387; 40 KB
-
 COVID-19 in China 2020 to April 20, 2022.png 528 × 381; 20 KB
-
 COVID-19-China-log.svg 540 × 405; 88 KB
-
 COVID-19-Pandemie - CN (China) - Infizierte (800px).svg 800 × 450; 467 KB
-
 COVID-19-Pandemie - CN (China) - Tote (800px).svg 800 × 450; 477 KB
-
 CSI 300 index during the 2019-nCoV outbreak in 2020.png 1,217 × 603; 22 KB
-
 Daily coal consumption china before after new year.png 768 × 531; 103 KB
-
 Daily CoViD CN.svg 886 × 531; 17 KB
-
 Erkrankungen - Tode in China (Stand- 27.01.2020).png 1,294 × 735; 21 KB
-
 Estimation of the number of COVID-19 cases in Wuhan.png 1,345 × 760; 288 KB
-
 Estimativa de subnotificações COVID-19 - Estudo do CMMID.png 706 × 612; 47 KB
-
 EvolutionCoVid19China.png 872 × 631; 51 KB
-
 Fighting COVID-19,Chart1.jpg 900 × 631; 133 KB
-
 Fighting COVID-19,Chart2.jpg 900 × 444; 88 KB
-
 Fighting COVID-19,Chart3.jpg 900 × 528; 99 KB
-
 Fighting COVID-19,Chart4.jpg 900 × 539; 92 KB
-
 Fighting COVID-19,Chart5.jpg 900 × 699; 204 KB
-
 Fighting COVID-19,Chart6.jpg 900 × 631; 150 KB
-
 Fighting COVID-19,Chart7.jpg 900 × 671; 188 KB
-
 Fighting COVID-19,Chart8.jpg 900 × 610; 177 KB
-
 Illustration of Covid 19 Case Fatality Rate by Comorbidity-1.png 1,920 × 1,080; 169 KB
-
 Illustration of SARS-COV-2 Case Fatality Rate 200228 01-1.png 433 × 381; 12 KB
-
 In covid-19 data from China CDC Weekly 2020, 2(8), pp. 113-122.png 800 × 600; 66 KB
-
 Log-linear plot of coronavirus cases with linear regressions.png 800 × 700; 19 KB
-

-

-
 NCoV2019chinaconfirmed.png 964 × 775; 35 KB
-
 NCoV2019confirmed.png 511 × 711; 43 KB
-
 NCoV20200209 Hubei China ROW cases.png 800 × 700; 20 KB
-
 NCoV20200223 daily deaths by region.png 800 × 700; 18 KB
-
 NCoV4FEBwide3v.png 1,130 × 565; 71 KB
-
 NCoVFEB3long.png 891 × 493; 44 KB
-
 NCoVplotly1FEB.png 458 × 638; 1.12 MB
-

-
 Novel-coronavirus-nCoV-distribution-laboratory-confirmed-cases-worldwide.png 2,000 × 784; 281 KB
-
 Semi-log plot daily incidence of nCoV.png 800 × 700; 13 KB
-
 Severity-of-coronavirus-cases-in-China-1.png 2,000 × 1,442; 138 KB
-
 Severity-of-coronavirus-cases-in-China-1.svg 482 × 362; 12 KB
-
 Tabella tasso di mortalità per COVID-19 in Cina.png 1,467 × 1,077; 47 KB
-

-
 Trajectoire épidémie covid-19.png 3,330 × 2,220; 207 KB
-
-
 WHO Covid 2020 Jan-Aug daily C China.pdf 3,300 × 1,950; 25 KB
-
 WHO Covid C China.pdf 3,300 × 1,950; 18 KB
-
 WHO Covid rn confirmed,deaths Western Pacific Region01.pdf 3,300 × 1,950; 29 KB
-
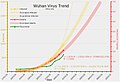 Wuhan Virus Trends (China Only).jpg 1,065 × 725; 129 KB
-
 График умерших и излеченных от пневмонии нового коронавируса в Китае.png 1,369 × 767; 140 KB
-
 中国境内新型冠状病毒感染的肺炎各省市区每日新增确诊病例数(除湖北).png 1,800 × 4,500; 1.17 MB
-
 中国境内新型冠状病毒感染的肺炎各省市区每日新增确诊病例数(除湖北)直方图.png 2,400 × 3,000; 896 KB
-
 中国境内新型冠状病毒感染的肺炎疫情报告.svg 512 × 410; 1.38 MB
-
 中国境内新型冠状病毒感染的肺炎疫情报告(2020-01-25).png 5,100 × 3,000; 596 KB


,_pp._113-122.png)

,_pp._113-122_(cropped).png)
,_pp._113-122.png)
,_pp._113-122.png)


_-_Infizierte_(800px).svg)
_-_Tote_(800px).svg)


.png)


,_pp._113-122.png)


,_pp._113-122.png)
.jpg)


