Category:Device current-voltage characteristics
Jump to navigation
Jump to search
current output as a function of applied voltage for a material or device | |||||
| Upload media | |||||
| Subclass of |
| ||||
|---|---|---|---|---|---|
| Said to be the same as | Q31453043 | ||||
| |||||
Subcategories
This category has only the following subcategory.
D
Media in category "Device current-voltage characteristics"
The following 134 files are in this category, out of 134 total.
-

-

-
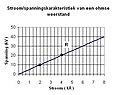
 5kOhm resistance.svg 800 × 740; 2 KB
-
 Abnormal glow.jpg 801 × 566; 49 KB
-
 Active i-to-v attr iv curves neg 1000.jpg 1,000 × 707; 55 KB
-
 Active i-to-v attr iv curves pos 1000.jpg 1,000 × 711; 56 KB
-
 Active negative resistance - current controlled.svg 963 × 955; 8 KB
-
 Active negative resistance - voltage controlled.svg 963 × 955; 11 KB
-
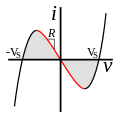
 Active negative resistance definition.svg 338 × 271; 12 KB
-
 APD2-ru.svg 723 × 628; 5 KB
-
 APD2.png 299 × 228; 8 KB
-
 Battery IV curve showing negative static resistance.svg 592 × 741; 11 KB
-
 Bistable decreasing current 1000.jpg 1,000 × 710; 95 KB
-
 Bistable decreasing voltage 1000.jpg 1,000 × 715; 102 KB
-
 Bistable increasing current 1000.jpg 1,000 × 712; 98 KB
-
 Bistable increasing voltage 1000.jpg 1,000 × 712; 104 KB
-
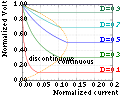
 Boost continuo discontinuo.svg 600 × 480; 40 KB
-
 Boost continuous discontinuous french.png 1,500 × 1,050; 62 KB
-
 Boost continuous discontinuous.png 1,500 × 1,050; 38 KB
-
 Boost continuous discontinuous.svg 600 × 480; 39 KB
-
 Buck continuous discontinuous french.png 1,500 × 1,050; 35 KB
-
 Buck continuous discontinuous.png 1,500 × 1,050; 39 KB
-
 Buck continuous discontinuous.svg 600 × 480; 43 KB
-
 Buck-boost continuous discontinuous.svg 350 × 300; 33 KB
-
 Caractéristique résistance.PNG 263 × 225; 3 KB
-
 Carbon nanotube fet.png 537 × 544; 18 KB
-
 ChildLangmuirLawGraph1.png 777 × 735; 20 KB
-
 ChildLangmuirLawGraph1.svg 360 × 360; 16 KB
-
 Common emitter load line.PNG 512 × 384; 9 KB
-
 Computer Transistor 1964 CollCurrDiag.jpg 594 × 348; 30 KB
-
 Current controlled negative resistance.svg 686 × 686; 15 KB
-
 Current voltage characteristic of arc discharge with hot cathode.jpg 818 × 591; 70 KB
-
 Current-driven neg resistor graph.svg 1,052 × 744; 21 KB
-
 Current-voltage characteristic of UJT.svg 741 × 641; 2 KB
-
 Current-Voltage relationship of BJT zh.png 976 × 589; 44 KB
-
 Current-Voltage relationship of BJT.png 981 × 590; 42 KB
-
 Curva di scarica del gas.JPG 960 × 720; 41 KB
-
 Detector regions (es).JPG 3,774 × 1,860; 488 KB
-
 Detector regions.gif 960 × 720; 60 KB
-
 Diagram negative resistance.GIF 344 × 198; 3 KB
-
 Diagram negative resistance.PNG 344 × 198; 4 KB
-
 Diagram negative resistance.svg 762 × 383; 2 KB
-
 DifferentialChordalResistance.svg 374 × 246; 16 KB
-
 DifferentialResistance UI.svg 374 × 246; 6 KB
-
 Diode mosfet fr.png 1,500 × 1,050; 66 KB
-
 Diode mosfet.png 1,500 × 1,050; 72 KB
-
 Diode mosfet.svg 480 × 320; 10 KB
-
 Early effect (graph - I C vs V CE)-RU.svg 300 × 125; 27 KB
-
 Early effect (graph - I C vs V CE)-ru.svg 688 × 462; 18 KB
-
 Early effect (graph - I C vs V CE).svg 300 × 125; 25 KB
-
 Early effect (IC-VCE) zh-hans.svg 800 × 400; 16 KB
-
 Early effect (IC-VCE) zh-hant.svg 800 × 400; 17 KB
-
 Fig3DefectScattering.JPG 590 × 903; 31 KB
-
 Flyback continuous discontinuous french.svg 600 × 480; 38 KB
-
 FourIVcurves-ru.svg 737 × 180; 4 KB
-
 FourIVcurves.svg 1,536 × 314; 22 KB
-
 Gaaslahenduse Volt-Amper karakteristik.png 800 × 494; 68 KB
-
 Giunzione p–n vs. diodo ideale.png 532 × 335; 2 KB
-
 Glow discharge current-voltage curve (es).svg 1,103 × 718; 60 KB
-
 Glow discharge current-voltage curve English.svg 1,103 × 718; 60 KB
-
 Glow discharge current-voltage curve vertical.svg 731 × 1,082; 74 KB
-
 GlowDischargeVoltAmpere-bul.jpg 1,146 × 708; 66 KB
-
 GlowDischargeVoltAmpere.jpg 1,146 × 708; 98 KB
-
 I U Kennlinien einfach.png 2,400 × 495; 97 KB
-
 I-to-v iv curves 1000.jpg 1,000 × 701; 46 KB
-
 I-V curve of 10mA germanium tunnel diode..jpg 3,008 × 2,000; 3.01 MB
-
 Iv curves2 1000.jpg 1,000 × 708; 52 KB
-
 Iv curves2 N 1000.jpg 1,000 × 745; 50 KB
-
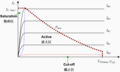
 IvsV IGBT.png 1,500 × 1,050; 30 KB
-
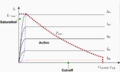
 IvsV mosfet.png 1,500 × 1,050; 42 KB
-
 IvsV mosfet.svg 480 × 320; 43 KB
-
 Kennlinie nichtlinear.png 222 × 250; 9 KB
-
 Krystadyna charakterystyka prądowo-napięciowa-ru.svg 726 × 450; 2 KB
-
 Krystadyna charakterystyka prądowo-napięciowa.svg 281 × 197; 17 KB
-
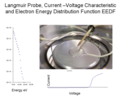 Langmuir Probe Current Voltage Characteristic.png 803 × 642; 453 KB
-
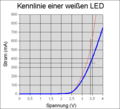 Ledwhitecharcurp.png 538 × 490; 5 KB
-
 Multistable current controlled negative resistance.svg 767 × 1,005; 9 KB
-
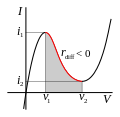
 Negative differential resistance definition.svg 362 × 238; 17 KB
-
 Negative differential resistance.png 900 × 900; 42 KB
-
 Negative differential resistance.svg 524 × 478; 52 KB
-
 Negative impedance converter IV curve.svg 1,058 × 690; 20 KB
-
 Negative resistance amplification.svg 946 × 844; 18 KB
-
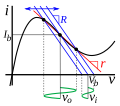
 Negative resistance oscillator load lines.svg 948 × 569; 25 KB
-
 Negative resistance stability regions CCNR.svg 611 × 586; 27 KB
-
 Negative resistance stability regions VCNR.svg 627 × 597; 24 KB
-
 Negative resistance vs loop gain.svg 875 × 875; 17 KB
-
 Negative static resistance definition.svg 262 × 261; 10 KB
-
 Neon bulb relaxation oscillator hysteresis curve 2.svg 1,035 × 1,800; 35 KB
-
 Neon bulb relaxation oscillator hysteresis curve.svg 2,021 × 1,074; 30 KB
-
 NeonLampCharacteristicCurve.svg 719 × 439; 18 KB
-
 NNR step 0 1000.JPG 1,000 × 769; 94 KB
-
 NR step 0.JPG 2,175 × 3,115; 873 KB
-
 Ohmic device and non-ohmic device.png 800 × 600; 42 KB
-
 Ohmic resistance.svg 338 × 271; 7 KB
-
 P-n junction characteristics.svg 400 × 400; 5 KB
-
 Photodiode operation.png 1,280 × 938; 42 KB
-
 ProgrammableUnijunctionTransistor01.jpg 762 × 307; 17 KB
-
 PUT-SNG-ABB01.svg 513 × 209; 52 KB
-
 P–n junction breakdown.png 218 × 197; 579 bytes
-
 Quadrants of IV plane-ru.svg 606 × 496; 2 KB
-
 Quadrants of IV plane.svg 686 × 686; 15 KB
-
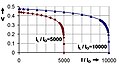
 Resistance effects on solar cell IV curve.jpg 1,062 × 632; 152 KB
-
 Rtd seq v3.gif 453 × 362; 73 KB
-
 Second derivative.gif 2,316 × 638; 17 KB
-
 Solar cell characterisitcs.JPG 851 × 474; 46 KB
-
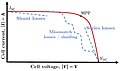
 Solar-Cell-IV-curve-with-MPP.png 526 × 480; 15 KB
-
 SolarCell-IVgraph3-E.PNG 259 × 205; 4 KB
-
 SolarCell-IVgraph3-E.svg 600 × 500; 12 KB
-
 Stopping Voltage Diagram.svg 270 × 180; 26 KB
-
 Thyristor I-V diagram.svg 374 × 276; 12 KB
-
 TRIAC 19630622.svg 767 × 754; 23 KB
-
 TriodeECC83Characteristic1-ru.svg 716 × 632; 27 KB
-
 TriodeECC83Characteristic1.png 827 × 535; 36 KB
-
 Tun diode amp 1000.jpg 1,000 × 707; 87 KB
-
 Tunnel diode amplifier graph.svg 1,103 × 967; 22 KB
-
 Tunnel diode vac.png 247 × 274; 4 KB
-
 TySETcharacteristics.png 2,075 × 2,442; 172 KB
-
 U-I-karakteristiek.jpg 393 × 312; 45 KB
-
 UJT caratteristica.png 593 × 347; 4 KB
-
 UY224 tetrode plate current negative resistance.svg 1,374 × 1,119; 34 KB
-
 V-a characteristic of bjt with base not connected.svg 258 × 196; 8 KB
-
 V-a characteristic of bjt with grounded base.svg 258 × 196; 6 KB
-
 V-to-i converter iv curves 1000.jpg 1,000 × 706; 47 KB
-
 Varistor voltage-current curve.png 1,578 × 1,203; 14 KB
-
 VIcharacteristicSolarCell.jpg 280 × 196; 11 KB
-
 Voltage controlled negative resistance.svg 702 × 686; 14 KB
-
 Voltage regulator foldback.svg 278 × 276; 45 KB
-
 Voltajes y corrientes en el anodo.png 285 × 254; 21 KB
-
 Welding-voltamper-char-source.png 640 × 600; 29 KB
-
 Whole cell IV showing rest and AP thresh.jpg 667 × 500; 32 KB
-
 Gráfica característica SCR.jpg 383 × 215; 22 KB
-
 Динатронный эффект в триоде Mullard при Uc=200V.PNG 521 × 474; 13 KB
-
 Инверсия анодного тока ВАХ тетрода 24А.PNG 505 × 399; 10 KB
-
 Инверсия анодного тока ВАХ тетрода 24А.svg 1,552 × 1,375; 2 KB


.JPG)


-RU.svg)
-ru.svg)
.svg)
_zh-hans.svg)
_zh-hant.svg)


.svg)


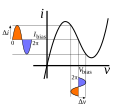
_High-Field_Domain_dark_region_(b)_Domain_width_vs._bias_(c)_current_voltage_characteristic.jpg)
_domain_width_as_function_of_bias_(A)_for_cathode-_(B)_for_anode-adjacent_domain._(d)_current-voltage_characteristic_showing_saturation_through_the_transition_point_at_2_kV_bias.jpg)