Category:Demographic charts of the United Kingdom
Appearance
Subcategories
This category has the following 4 subcategories, out of 4 total.
Media in category "Demographic charts of the United Kingdom"
The following 43 files are in this category, out of 43 total.
-
0107england ethnicity.jpg 560 × 673; 36 KB
-
01england ethnicity.jpg 747 × 481; 29 KB
-
07england ethnicity.jpg 651 × 481; 26 KB
-
Ashford Population.jpg 832 × 624; 64 KB
-
Asylumapplicants.jpg 2,049 × 1,486; 286 KB
-
Birth rates in the UK.png 711 × 439; 19 KB
-
BirthDeath 1950 GB.svg 480 × 280; 8 KB
-
Births and deaths in the UK.png 787 × 541; 29 KB
-
England ethnicity estimates 2009.jpg 1,105 × 581; 76 KB
-
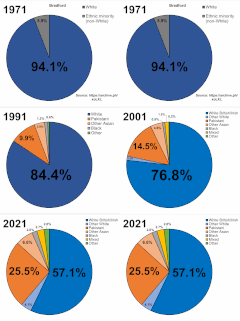
Ethnic demography of Bradford over time.gif 1,200 × 1,066; 486 KB
-
Ethnic demography of Coventry over time.gif 1,200 × 1,134; 407 KB
-
Ethnic demography of Nottingham over time.gif 1,200 × 1,150; 479 KB
-
Ethnic groups in the United Kingdom graph.png 443 × 331; 13 KB
-
Ethnicity in England (2005 chart).png 547 × 372; 124 KB
-
Ethnicity in England (2005 chart)ar.png 547 × 372; 110 KB
-
Foreignborn.jpg 995 × 615; 68 KB
-
Graf zide spojene-kralovstvi.jpg 451 × 315; 22 KB
-
Grants of British citizenship to Somali nationals.png 910 × 661; 40 KB
-
Graph rel share world manuf 1750 1900 01.png 568 × 347; 6 KB
-
Graph rel share world manuf 1750 1900 02.png 527 × 299; 3 KB
-
Industry of Employment in Worlingworth 2011.png 1,376 × 852; 123 KB
-
Inflowandoutflow.jpg 936 × 654; 54 KB
-
NairnPopulationChart.png 697 × 371; 20 KB
-
Population of Beeston, Nottinghamshire.svg 580 × 250; 3 KB
-
Population of Norbury according to the 2011 census.jpg 1,000 × 667; 52 KB
-
Population of Rockcliffe Parish through time.jpg 1,360 × 563; 112 KB
-
Population of Suffolk.png 976 × 638; 23 KB
-
Populations of the nations in the United Kingdom.svg 425 × 135; 4 KB
-
Post-World War Two Maltese migration to the UK.png 981 × 642; 55 KB
-
PSM V70 D575 Population increase of the usa compared to major european states.png 1,660 × 2,327; 186 KB
-
Regional Profile of London (as of 2013).png 2,917 × 5,886; 514 KB
-
RNI 1950 GB.svg 480 × 264; 7 KB
-
Rockcliffe Population.jpg 1,360 × 563; 44 KB
-
RU-Demografía-Paises-Porcentaje.png 262 × 199; 3 KB
-
Total UK immigration removals 1973-2010.jpg 771 × 329; 39 KB
-
UK asylum applications 1979-2009.jpg 628 × 435; 37 KB
-
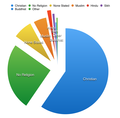
UK Religion 2011 Census.png 1,048 × 1,030; 192 KB
-
UKdemographicreligion.svg 515 × 410; 14 KB
-
UKDemographics-Age.svg 900 × 700; 10 KB
-
UKDemographics-Religion.svg 900 × 900; 16 KB
-
UKinflation change.png 437 × 363; 38 KB
-
UKinflation.png 539 × 438; 27 KB


