Category:Data mining
Jump to navigation
Jump to search
the process of extracting and discovering patterns in large data sets | |||||
| Upload media | |||||
| Subclass of |
| ||||
|---|---|---|---|---|---|
| Facet of | |||||
| |||||
Subcategories
This category has the following 9 subcategories, out of 9 total.
A
C
D
E
- Tina Eliassi-Rad (4 F)
K
O
- Orange (software) (3 F)
R
- RapidMiner (4 F)
W
- Weka (machine learning) (19 F)
Media in category "Data mining"
The following 112 files are in this category, out of 112 total.
-
AirqACP.png 667 × 663; 35 KB
-
Ajosiu99.png 664 × 402; 93 KB
-
Algorithm kmeans.png 571 × 614; 98 KB
-
-
Aoiwerjmiokd.png 647 × 272; 40 KB
-
Applications DATAMINING.jpg 770 × 510; 93 KB
-
Association ex in py.png 1,311 × 762; 112 KB
-
Association Rule Mining Venn Diagram.png 919 × 567; 16 KB
-
Basic bic.pdf 1,050 × 1,050; 14 KB
-
Basic cluster.pdf 1,050 × 1,050; 23 KB
-
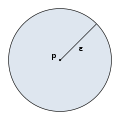
Boule centre p rayon epsilon.svg 248 × 248; 9 KB
-
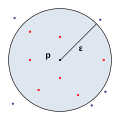
Boule points.svg 248 × 248; 21 KB
-
Cadre.jpg 1,208 × 295; 138 KB
-
CART tree titanic survivors.png 360 × 340; 7 KB
-
Classification Tree widget in Orange 3.0.PNG 662 × 419; 25 KB
-
ClusteringResults.PNG 635 × 580; 17 KB
-
Combinatorial GMDH optimal complexity.png 320 × 283; 12 KB
-
Compactness Comparison of Linear and Multilinear Projections.png 791 × 614; 65 KB
-
Comparison of Data Complexity with Raw CPU speed, over time.pdf 1,754 × 1,239; 20 KB
-
Completeness Table for Data Editing.png 315 × 125; 10 KB
-
ConfusionMatrix.png 623 × 382; 42 KB
-
Convolutional-neural-network-polyanalyst-flowchart-example.png 561 × 190; 20 KB
-
Coord-ellipses.PNG 814 × 652; 26 KB
-
Correspondence-analysis-columns.PNG 950 × 636; 50 KB
-
Correspondence-analysis-rows.PNG 950 × 636; 52 KB
-
CRISP DM Data mining management process.jpg 662 × 680; 59 KB
-
CRISP DM.png 726 × 623; 59 KB
-
CRISP-DM Process Diagram.png 3,707 × 3,714; 608 KB
-
CRISP-DM.png 500 × 485; 69 KB
-
CRISP.jpg 363 × 240; 60 KB
-
CRISPDM-Extended-Majid.png 1,784 × 1,428; 178 KB
-
Crispdm.png 754 × 545; 55 KB
-
Customize bic.pdf 1,050 × 1,050; 16 KB
-
Data Fusion - Scatter plot.png 719 × 651; 22 KB
-
Data mining.JPG 580 × 388; 53 KB
-
Data ScienceTech Institute Square Logo.png 3,337 × 3,198; 152 KB
-
Data Wrangling From Messy To Clean Data Management.jpg 1,404 × 301; 39 KB
-
DataAppliedWeb.png 768 × 575; 312 KB
-
Datamining vers la Connaissance.jpg 625 × 266; 17 KB
-
Datamining.jpg 349 × 297; 14 KB
-
DeepInsight method to transform non-image data to 2D image for convolutional neural network architecture.pdf 1,239 × 1,629, 7 pages; 1.78 MB
-
Dendro.jpg 1,201 × 900; 31 KB
-
Diagramme du Processus CRISP-DM.png 3,707 × 3,714; 907 KB
-
Different types of biclusters.jpg 1,152 × 576; 33 KB
-
Duplicate Data Entries in Data Editing.png 683 × 172; 21 KB
-
Elmap breastcancer wiki.png 561 × 661; 133 KB
-
EM Clustering of Old Faithful data.gif 360 × 309; 113 KB
-
Esssssa1.png 708 × 223; 42 KB
-
Ex-visualization1.jpg 315 × 556; 22 KB
-
Example for Adjusted Rand index.svg 900 × 360; 467 KB
-
Exemplo1 1.jpg 553 × 431; 28 KB
-
Flea beetles resultats adl.jpg 670 × 456; 76 KB
-
FSA-Red Algorithm.jpg 218 × 474; 45 KB
-
Gaussian bic.pdf 1,050 × 1,050; 12 KB
-
GraficoComparativo.gif 810 × 445; 41 KB
-
Hgrandrade example.jpeg 480 × 308; 9 KB
-
History of mining.svg 468 × 200; 11 KB
-
HubandAuthority.png 707 × 672; 81 KB
-
Kingstonsmit at hushmail.png 674 × 527; 48 KB
-
KXEN logo.png 455 × 170; 11 KB
-
LatticeMiner Architecture.JPG 574 × 353; 18 KB
-
LatticeMiner Figure-2.JPG 679 × 459; 37 KB
-
LatticeMiner Figure-3.JPG 682 × 423; 29 KB
-
Lobster movement3.jpg 1,352 × 809; 88 KB
-
LOF.svg 655 × 585; 142 KB
-
Logical Consistency in Data Editing.png 365 × 122; 14 KB
-
ML dataset training validation test sets.png 1,280 × 558; 31 KB
-
Multilinear projection for dimension reduction of tensor.png 994 × 509; 26 KB
-
Méthode DATAMINING.jpg 932 × 238; 21 KB
-
OOB Error Example.png 1,314 × 834; 43 KB
-
Orange data mining, visual programming interface, May 2013.png 1,071 × 681; 168 KB
-
Orange-2.0.png 1,116 × 713; 36 KB
-
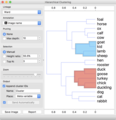
Orange-data-mining-hierarchical-clustering.png 1,224 × 1,270; 221 KB
-
Outliers in Data Editing.png 313 × 168; 10 KB
-
Plot NIR data.png 754 × 293; 64 KB
-
Plot Training Process.png 832 × 295; 39 KB
-
Predição de grupos com K-means (k=10).svg 512 × 417; 220 KB
-
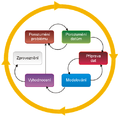
Processus DATAMINING.jpg 1,037 × 512; 66 KB
-
Projectwhistleblower datamining report.png 1,221 × 668; 184 KB
-
QSOFT DATA STUDIO.jpg 960 × 540; 76 KB
-
Rguidolini exemplo1 2 r outliers.jpg 594 × 550; 34 KB
-
Salmonella typhimurium.png 1,010 × 757; 396 KB
-
Saoidjfi99.png 613 × 257; 46 KB
-
Scraper.AI Screenshot.png 1,653 × 1,202; 157 KB
-
Screenshot Tanagra software.jpg 960 × 611; 194 KB
-
Sensor logger modem data chain - logos and explanations.jpg 1,278 × 453; 89 KB
-
Silhouette-plot-orange.png 1,304 × 1,494; 246 KB
-
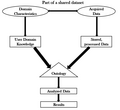
SimpleSemanticDataMiningDiagram.png 645 × 589; 28 KB
-
SlideQualityLife.png 1,164 × 892; 256 KB
-
Specificity vs Sensitivity Graph uk.png 1,244 × 908; 71 KB
-
Specificity vs Sensitivity Graph.png 1,244 × 908; 91 KB
-
SpiegelMining – Reverse Engineering von Spiegel-Online (33c3).webm 58 min 46 s, 1,920 × 1,080; 189.25 MB
-
Spurious correlations - spelling bee spiders LT.svg 1,040 × 410; 18 KB
-
Spurious correlations - spelling bee spiders.svg 1,040 × 410; 18 KB
-
Subspace-Identification-and-Classification-of-Healthy-Human-Gait-pone.0065063.s001.ogv 6.7 s, 960 × 504; 370 KB
-
Subspace-Identification-and-Classification-of-Healthy-Human-Gait-pone.0065063.s002.ogv 6.7 s, 960 × 504; 322 KB
-
SubspaceClustering.png 300 × 293; 27 KB
-
Surajustement Modèle 2.JPG 691 × 469; 28 KB
-
The-Stanford-Data-Miner-a-novel-approach-for-integrating-and-exploring-heterogeneous-immunological-1479-5876-10-62-S2.ogv 1 min 44 s, 1,380 × 558; 5.57 MB
-
The-Stanford-Data-Miner-a-novel-approach-for-integrating-and-exploring-heterogeneous-immunological-1479-5876-10-62-S3.ogv 2 min 4 s, 1,342 × 718; 9.31 MB
-
The-Stanford-Data-Miner-a-novel-approach-for-integrating-and-exploring-heterogeneous-immunological-1479-5876-10-62-S4.ogv 3 min 55 s, 1,376 × 720; 14.9 MB
-
Time Series conversion to SAX word.png 622 × 795; 34 KB
-
Underfitted Model.png 1,101 × 702; 42 KB
-
Underfitting fitted model.png 1,290 × 949; 59 KB
-
VariableImportancePlot.png 253 × 315; 9 KB
-
Variogramcloud01.png 671 × 670; 40 KB
-
Wum summary.jpg 1,012 × 823; 109 KB
-
نمودار 2.png 782 × 515; 36 KB
-
نمودار 3.png 738 × 525; 30 KB


