Category:Correlation and combination datagraphics by Our World in Data
Jump to navigation
Jump to search
Subcategories
This category has only the following subcategory.
Media in category "Correlation and combination datagraphics by Our World in Data"
The following 200 files are in this category, out of 426 total.
(previous page) (next page)-
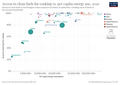
 Access to electricity, urban vs. rural, OWID.svg 850 × 600; 45 KB
-
-
-
 Access-to-electricity-urban-vs-rural (OWID 0011).png 850 × 600; 96 KB
-
 Actual teaching time vs time teachers are present, OWID.svg 850 × 600; 10 KB
-

-
 Alcohol-use-disorder-vs-alcohol-consumption.png 3,400 × 2,400; 604 KB
-
 Amaren heriotza-tasa vs biztanleko BPGa.png 998 × 589; 120 KB
-
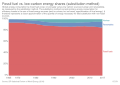
 Annual-primary-energy-fossil-vs-low-carbon (OWID 0096).png 850 × 600; 52 KB
-
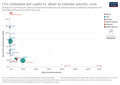
 Antibiotic use in livestock vs. meat supply per capita, OWID.svg 850 × 600; 30 KB
-

-
 Asperger Syndrome prevalence in males vs. females, OWID.svg 850 × 600; 41 KB
-
 Asperger-syndrome-prevalence-males-vs-females.png 3,400 × 2,400; 478 KB
-
 Attendance vs enrolment rates, primary education, OWID.svg 850 × 600; 16 KB
-
 Autism prevalence in males vs. females, OWID.svg 850 × 600; 41 KB
-
-
 Average hourly earnings of male and female employees, OWID.svg 850 × 600; 8 KB
-

-

-
 Average number of children vs child mortality, OWID.svg 850 × 600; 38 KB
-

-

-

-

-
 Average years of schooling vs. Corruption Perception Index, OWID.svg 850 × 600; 25 KB
-
 Average years of schooling vs. Expected years of schooling, OWID.svg 850 × 600; 38 KB
-
 Biomass-vs-abundance-taxa (OWID 0137).png 850 × 600; 65 KB
-
 Birth rate vs Death rate, OWID.svg 850 × 600; 41 KB
-
 Borrowing to start or expand business, men vs women, OWID.svg 850 × 600; 33 KB
-

-
 Capital intensity vs. labor productivity, OWID.svg 850 × 600; 59 KB
-
 Capture-and-aquaculture-production (OWID 0132).png 850 × 600; 60 KB
-
 Capture-fisheries-vs-aquaculture (OWID 0131).png 850 × 600; 67 KB
-
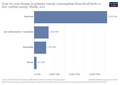
 Carbon-footprint-of-protein-foods-2.png 2,678 × 2,613; 411 KB
-
 Cardiovascular-disease-death-rate-over-time-males-vs-females.png 3,400 × 3,398; 896 KB
-
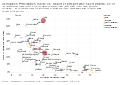
 Causes-of-death-in-USA-vs.-media-coverage.png 4,080 × 3,133; 532 KB
-
 Cereal crop yield vs. fertilizer application, OWID.svg 850 × 600; 37 KB
-
 Cereal yields vs. tractor inputs in agriculture, OWID.svg 850 × 600; 202 KB
-
 Cereal-crop-yield-vs-fertilizer-application (OWID 0112).png 850 × 600; 84 KB
-
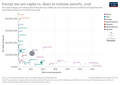
 Cereal-yield-vs-extreme-poverty (OWID 0109).png 850 × 600; 74 KB
-
 Cereal-yield-vs-extreme-poverty-scatter (OWID 0110).png 850 × 600; 117 KB
-
 Cereal-yields-vs-tractor-inputs-in-agriculture (OWID 0169).png 850 × 600; 121 KB
-
 Cereals-imports-vs-exports (OWID 0168).png 850 × 600; 106 KB
-
 Change-global-hunger-index-pop-growth (OWID 0160).png 850 × 600; 103 KB
-
 Change-of-cereal-yield-vs-land-used (OWID 0155).png 850 × 600; 69 KB
-
 Child death rates by cause for boys vs. girls in India, OWID.svg 850 × 600; 11 KB
-

-

-

-

-
 Child mortality rate vs population growth, OWID.svg 850 × 600; 118 KB
-
 Child mortality rate vs. Mean male height, OWID.svg 850 × 600; 37 KB
-

-
 Child mortality vs level of prosperity, OWID.svg 850 × 600; 37 KB
-
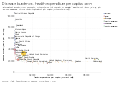
 Child mortality vs per capita total health expenditure, OWID.svg 850 × 600; 36 KB
-

-
 Child mortality vs type of political regime, OWID.svg 850 × 600; 33 KB
-
 Child mortality vs. extreme poverty, OWID.svg 850 × 600; 27 KB
-
 Child Mortality vs. Health Expenditure (Gapminder), OWID.svg 850 × 600; 101 KB
-
 Child mortality vs. health expenditure, OWID.svg 850 × 600; 40 KB
-
 Child mortality vs. mean years of schooling, OWID.svg 850 × 600; 80 KB
-

-
 Child mortality vs. Prevalence of child wasting, OWID.svg 850 × 600; 22 KB
-
 Child mortality vs. Prevalence of stunting, OWID.svg 850 × 600; 25 KB
-
 Child mortality vs. prevalence of teenage pregnancy, OWID.svg 850 × 600; 16 KB
-
 Child mortality vs. Share of children who are anemic, OWID.svg 850 × 600; 43 KB
-

-
 Child mortality- IHME vs UN IGME estimates, OWID.svg 850 × 600; 37 KB
-
 Child mortality- UN IGME vs UN DESA comparison, OWID.svg 850 × 600; 9 KB
-
 Child-mortality-from-ari-vs-treatment.png 3,400 × 2,400; 560 KB
-
 Children in employment vs hours worked by children, OWID.svg 850 × 600; 17 KB
-

-
 Children per woman (fertility rate) vs. level of prosperity, OWID.svg 850 × 600; 114 KB
-
-
 Children per woman vs population growth, OWID.svg 850 × 600; 43 KB
-
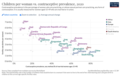 Children per woman vs. contraceptive prevalence, 2020.png 1,634 × 1,038; 310 KB
-
 Children per woman vs. Human Development Index, OWID.svg 850 × 600; 35 KB
-

-
 Children who experience violent discipline, boys vs girls, OWID.svg 850 × 600; 17 KB
-
-
 Co-emissions-per-capita-vs-population-growth (OWID 0148).png 850 × 600; 97 KB
-
-
 Co2-per-capita-vs-renewable-electricity (OWID 0183).png 850 × 600; 100 KB
-

-

-
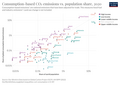
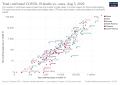
 Consumption-based CO₂ emissions vs. population share, OWID.svg 850 × 600; 24 KB
-
-
 Consumption-co2-emissions-vs-population (OWID 0251).png 850 × 600; 91 KB
-
 Consumption-co2-per-capita-vs-gdppc.svg 850 × 696; 87 KB
-
 Consumption-vs-production-co2-per-capita (OWID 0245).png 850 × 600; 85 KB
-
 Contraceptive prevalence- any methods vs modern methods, OWID.svg 850 × 600; 28 KB
-
-
 Covid-19-total-confirmed-cases-vs-total-confirmed-deaths.png 3,400 × 2,400; 848 KB
-
 Covid-19-total-confirmed-cases-vs-total-confirmed-deaths.svg 850 × 600; 57 KB
-

-

-
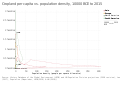 Cropland per capita vs. population density, OWID.svg 850 × 600; 15 KB
-
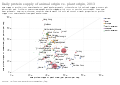 Daily protein supply of animal origin vs. plant origin, OWID.svg 850 × 600; 36 KB
-
 Daily-protein-supply-of-animal-origin-vs-plant-origin (OWID 0206).png 850 × 600; 110 KB
-
 Death rate from cancers vs. extreme poverty, OWID.svg 850 × 600; 26 KB
-
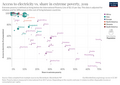
 Death rate from cancers vs. income inequality, OWID.svg 850 × 600; 27 KB
-
 Death rate from obesity vs. share of adults who are obese, OWID.svg 850 × 600; 36 KB
-

-

-

-
 Death-rate-from-pm25-vs-pm25-concentration (OWID 0319).png 850 × 600; 110 KB
-
 Death-rate-vs-share-obesity.png 3,400 × 2,400; 601 KB
-

-

-
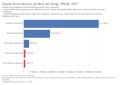 Deaths from tobacco, alcohol and drugs, OWID.svg 850 × 600; 7 KB
-

-
 Decomposition of the gender wage gap, 1, OWID.svg 850 × 600; 8 KB
-
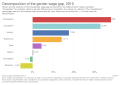 Decomposition of the gender wage gap, OWID.svg 850 × 600; 8 KB
-
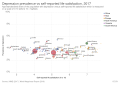 Depression prevalence vs self-reported life satisfaction, OWID.svg 850 × 600; 31 KB
-
 Depth of the food deficit in kilocalories per person per day, OWID.svg 850 × 600; 144 KB
-
 Diarrheal disease death rates vs. access to sanitation, OWID.svg 850 × 600; 36 KB
-
 Dietary land use vs. beef consumption, OWID.svg 850 × 600; 34 KB
-
 Dietary-land-use-vs-beef-consumption (OWID 0288).png 850 × 600; 98 KB
-
 Diphtheria vaccine coverage vs Diphtheria cases, OWID.svg 850 × 600; 15 KB
-
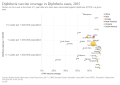
 Disease burden vs. health expenditure per capita, OWID.svg 850 × 600; 34 KB
-
 Disease-burden-vs-health-expenditure-per-capita (1).png 3,400 × 2,400; 635 KB
-

-
 Do more people live in urban or rural areas ? 2022.svg 850 × 600; 167 KB
-
 Do more people live in urban or rural areas., OWID.svg 850 × 600; 139 KB
-
 Domestic-forest-change-vs-imported-deforestation.svg 850 × 600; 46 KB
-
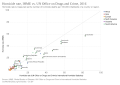
 Econimpact2vs15c (OWID 0270).png 850 × 600; 65 KB
-
 Economic Impacts of 2°C vs 1.5°C, OWID.svg 850 × 600; 141 KB
-
 Employment in agriculture vs. urban population, OWID.svg 850 × 600; 44 KB
-
 Employment rate with tertiary vs vocational education, OWID.svg 850 × 600; 14 KB
-
 Employment rates of 25-34 year-olds by education level, OWID.svg 850 × 600; 16 KB
-
 Employment-to-population ratio, men vs women, OWID.svg 850 × 600; 32 KB
-
-
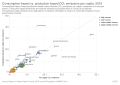
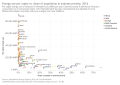
 Energy-use-per-capita-vs-co2-emissions-per-capita (OWID 0351).png 850 × 600; 78 KB
-
-
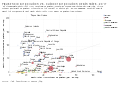
 Environmental-impact-of-food-by-life-cycle-stage.png 2,933 × 2,635; 453 KB
-

-
 Extreme-poverty-vs-prevalence-of-underweight-children.png 3,400 × 2,400; 562 KB
-

-

-
 Fertility rate vs the share living in extreme poverty, OWID.svg 850 × 600; 28 KB
-
 Fertility rate vs. contraceptive prevalence, OWID.svg 850 × 600; 12 KB
-
 Fertility rate vs. mean years of schooling, OWID.svg 850 × 600; 24 KB
-

-
 Fertility vs wanted fertility, OWID.svg 850 × 600; 19 KB
-

-
 Food supply vs life expectancy, OWID.svg 850 × 600; 34 KB
-
 Forest-area-primary-planted (OWID 0410).png 850 × 600; 48 KB
-
-
-

-
 Global biomass vs. abundance of taxa, OWID.svg 850 × 600; 9 KB
-

-
 Global Hunger Index vs. extreme poverty, OWID.svg 850 × 600; 62 KB
-
 Global infant mortality by cause for boys vs. girls, OWID.svg 850 × 600; 9 KB
-
 Gross vs. net enrollment rate in pre-primary education, OWID.svg 850 × 600; 30 KB
-
 Gross vs. net enrollment rate in primary education, OWID.svg 850 × 600; 38 KB
-
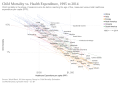
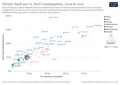
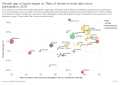
 Growth Rate vs Median Age, 2021.png 1,246 × 1,028; 239 KB
-
 Happiness vs Life satisfaction, OWID.svg 850 × 600; 18 KB
-
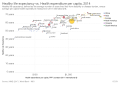 Healthy life expectancy vs. Health expenditure per capita, OWID.svg 850 × 600; 34 KB
-
 Hidden Hunger Index vs. extreme poverty, OWID.svg 850 × 600; 27 KB
-

-
 Homicide rate, IHME vs. UN Office on Drugs and Crime, OWID.svg 850 × 600; 21 KB
-
 Homicides rate vs. Prison population rate, OWID.svg 850 × 600; 35 KB
-
 Hourly Earnings.png 1,530 × 974; 246 KB
-
-
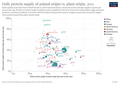
 Household-vs-outdoor-air-pollution-death-rates (OWID 0512).png 850 × 600; 107 KB
-

-

-

-
 Human Capital Index in males vs. females, OWID.svg 850 × 600; 28 KB
-
 Human Development Index vs. Corruption Perception Index, OWID.svg 850 × 600; 36 KB
-

-
 Human Development Index vs. Mean male height, OWID.svg 850 × 600; 33 KB
-
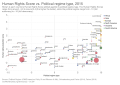 Human Rights Score vs. Political regime type, OWID.svg 850 × 600; 33 KB
-

-

-
-
 Indoor-pollution-death-rates-clean-fuels (OWID 0492).png 850 × 600; 93 KB
-
-
 Infant mortality vs. prevalence of prenatal care, OWID.svg 850 × 600; 30 KB
-
 Infant-mortality-vs-prenatal-care.png 3,400 × 2,400; 535 KB
-
 Interpersonal trust vs. income inequality, OWID.svg 850 × 600; 17 KB
-
 Knowledge about HIV prevention in young men vs. women, OWID.svg 850 × 600; 20 KB
-
 Labor productivity and capital intensity, OWID.svg 850 × 600; 18 KB
-
 Labour force participation, younger vs older women, OWID.svg 850 × 600; 36 KB
-
 Land ownership, men vs women, OWID.svg 850 × 600; 14 KB
-
 Land use vs. yield change in cereal production, OWID.svg 850 × 600; 103 KB
-
 Land-ownership-men-vs-women (OWID 0591).png 850 × 600; 90 KB
-
 Land-use-vs-yield-change-in-cereal-production (OWID 0581).png 850 × 600; 92 KB
-
 Learning outcomes, minimum vs advanced achievement, OWID.svg 850 × 600; 25 KB
-
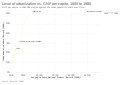 Level of urbanization vs. GNP per capita, OWID.svg 850 × 600; 9 KB
-
 Level-of-income-top-10-vs-bottom-10 (OWID 0571).png 850 × 600; 56 KB
-
 Life expectancy at birth vs. CO₂ emissions per capita, OWID.svg 850 × 600; 43 KB
-
 Life expectancy by country, males vs. females.svg 850 × 600; 71 KB
-
 Life expectancy of women vs life expectancy of men, OWID.svg 850 × 600; 39 KB
-
 Life expectancy vs healthcare spending.jpg 1,876 × 1,816; 553 KB
-

-
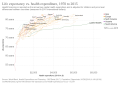
 Life expectancy vs. health expenditure per capita, OWID.svg 850 × 600; 36 KB
-
 Life expectancy vs. health expenditure, OWID.svg 850 × 600; 40 KB
-
 Life expectancy vs. healthcare expenditure, OWID.svg 850 × 600; 40 KB

.png)
.png)
.png)

,_OWID.svg)


.png)


_vs_national_literacy_rate,_OWID.svg)


.png)


,_OWID.svg)

.png)
.png)


.png)
.png)
.png)
.png)
.png)
.png)
.png)


,_OWID.svg)


,_OWID.svg)


_vs._level_of_prosperity,_OWID.svg)


,_OWID.svg)

.png)
.png)
.png)
.png)
,_OWID.svg)


.png)

.png)


.png)


.png)
.png)

.png)


.png)


.png)


.png)


.png)


.png)
.png)

_vs_Life_expectancy_at_birth,_OWID.svg)


.png)
,_OWID.svg)

,_OWID.svg)


.png)


.png)


.png)
.png)


.png)


