Category:Complex color plots
Appearance
technique for visualizing complex functions | |||||
| Upload media | |||||
| Time of discovery or invention |
| ||||
|---|---|---|---|---|---|
| |||||
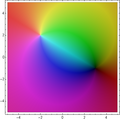
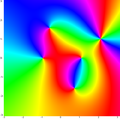
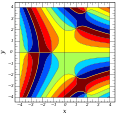
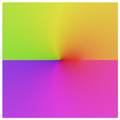
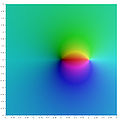
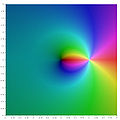
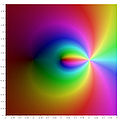
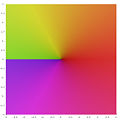
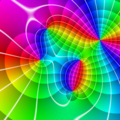
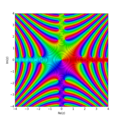
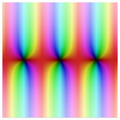
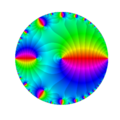
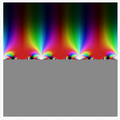
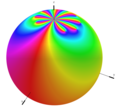
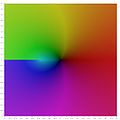
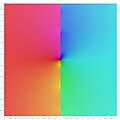
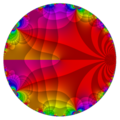
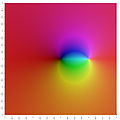
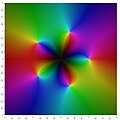
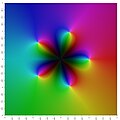
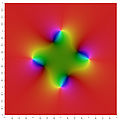
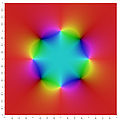
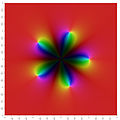
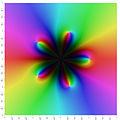
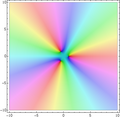
Complex color plots depict the argument of a function in the complex plane as a certain color. Sometimes the brightness value of the function represents the absolute value of the complex function.
Subcategories
This category has the following 8 subcategories, out of 8 total.
Media in category "Complex color plots"
The following 183 files are in this category, out of 183 total.
-
((z-4i+3)(z-2-3i)z)over((z+2i+4)(z+3i-2).png 450 × 450; 90 KB
-
(2i+1)z.png 450 × 450; 61 KB
-
(5(z+4)(z+3i-1))over((z-3i)(z-3)(z+4i-2)).png 450 × 450; 90 KB
-
(iz+2)(z^2-i)over(z^3-3).png 450 × 450; 66 KB
-
(z+4-i) (z-2i-3)(z-3+i)z.png 450 × 450; 70 KB
-
(z-3+i)over(z-2i+2).png 450 × 450; 74 KB
-
(z-i-1)over(z+1).png 450 × 450; 56 KB
-
(z^2-1)over(z^2+1).png 450 × 450; 85 KB
-
(z^2-2)over(z^3+1).png 450 × 450; 83 KB
-
(z^3-1)over(z^2+1).png 450 × 450; 83 KB
-
(z^3-1)over(z^3+1).png 450 × 450; 89 KB
-
0,1z.png 450 × 450; 64 KB
-
10z.png 450 × 450; 53 KB
-
1over(z^7-z).png 450 × 450; 100 KB
-
1overz^2.png 450 × 450; 75 KB
-
5((z-2i)(z-1+i)^2)over(z+3-2i)^3.png 450 × 450; 92 KB
-
5th-root-of-unity.jpg 553 × 543; 62 KB
-
A complex function.png 620 × 620; 175 KB
-
AiryAi Arg Contour.svg 480 × 460; 74 KB
-
AiryBi Arg Contour.svg 480 × 460; 95 KB
-
Archaversine in complex plane.png 6,020 × 6,010; 1.6 MB
-
Attraction zones of Laguerre's.png 512 × 512; 2 KB
-
BarrierWave.gif 695 × 229; 206 KB
-
Blaschke-product.png 1,031 × 957; 1.35 MB
-
Color complex plot.jpg 800 × 800; 203 KB
-
Color complex plot2.jpg 800 × 800; 202 KB
-
Complex 4th root.jpg 840 × 840; 163 KB
-
Complex Conjugate.png 450 × 450; 65 KB
-
Complex cube root.jpg 1,260 × 420; 131 KB
-
Complex Graph Natural Log.png 1,366 × 728; 357 KB
-
Complex plot for Factorial.png 1,240 × 1,232; 249 KB
-
Complex polylog0.jpg 847 × 847; 65 KB
-
Complex polylog1.jpg 853 × 853; 68 KB
-
Complex polylog2.jpg 853 × 853; 70 KB
-
Complex polylog3.jpg 855 × 855; 73 KB
-
Complex polylogminus1.jpg 852 × 852; 74 KB
-
Complex polylogminus2.jpg 860 × 860; 85 KB
-
Complex polylogminus3.jpg 856 × 856; 87 KB
-
Complex Riemann Xi.jpg 853 × 853; 162 KB
-
Complex sqrt leaf1.jpg 641 × 641; 92 KB
-
Complex sqrt leaf2.jpg 649 × 649; 93 KB
-
Complex theta minus0point1times e i pi 0point1.jpg 681 × 681; 116 KB
-
Complex x hoch 3.jpg 651 × 651; 135 KB
-
Complex x hoch 3.PNG 649 × 633; 580 KB
-
Complex x hoch 5.jpg 656 × 656; 139 KB
-
Complex x hoch 5.PNG 657 × 643; 649 KB
-
Complex zeta.jpg 821 × 820; 233 KB
-
Cos(z).png 450 × 450; 56 KB
-
Dedekind Eta.jpg 925 × 231; 78 KB
-
DirichletEta.png 348 × 552; 193 KB
-
Domain coloring x2-1 x-2-i x-2-i d x2+2+2i.xcf 2,000 × 2,000; 15.09 MB
-
Domain coloring x2-1 x-2-i x-2-i d x2+2+3i.jpg 2,000 × 2,000; 1 MB
-
Eisenstein 10.jpg 658 × 334; 124 KB
-
Eisenstein 12.jpg 658 × 333; 127 KB
-
Eisenstein 14.jpg 657 × 333; 127 KB
-
Eisenstein 4.jpg 644 × 327; 110 KB
-
Eisenstein 6.jpg 645 × 328; 117 KB
-
Eisenstein 8.jpg 646 × 329; 124 KB
-
Erf(z).png 648 × 640; 378 KB
-
F(z)=-z.png 450 × 450; 65 KB
-
Faddeeva function.png 1,024 × 1,024; 685 KB
-
Fresnel-cos.png 700 × 700; 567 KB
-
Fresnel-sin.png 700 × 700; 575 KB
-
GeometricSeries.PNG 365 × 363; 197 KB
-
Goodwin-Staton integral Im density plot.JPG 409 × 401; 23 KB
-
Haversine in complex plane.png 4,020 × 4,014; 1.97 MB
-
Hurwitza1ov3.png 700 × 700; 281 KB
-
Hurwitza1ov3v2.png 435 × 639; 275 KB
-
Hurwitza24ov25.png 800 × 600; 187 KB
-
Hurwitza24ov25v2.png 400 × 561; 179 KB
-
HurwitzofAz3p4j.png 600 × 600; 262 KB
-
I*z.png 450 × 450; 65 KB
-
Identität.png 450 × 450; 65 KB
-
Integral of haversine in complex plane.png 4,020 × 4,014; 2.21 MB
-
Inverse gamma function in complex plane.png 4,000 × 4,000; 407 KB
-
Julia-set N z3-1.png 2,000 × 1,500; 1.2 MB
-
KleinInvariantJ.jpg 947 × 704; 324 KB
-
KleinjCont.png 600 × 600; 453 KB
-
KleinjHSV.png 600 × 600; 392 KB
-
Lambda star function in range -1 to 1.png 2,048 × 2,040; 924 KB
-
Lambda star function in range -3 to 3.png 2,048 × 2,049; 1,011 KB
-
Lambert-series.png 360 × 360; 85 KB
-
LogColorKey.png 373 × 346; 12 KB
-
LogComplexColorRect.png 971 × 893; 247 KB
-
Mathematica coloring function.jpg 831 × 605; 141 KB
-
Modular lambda function in range -3 to 3.png 2,048 × 2,049; 594 KB
-
Newton z3 -z 2 iterate-1.jpg 800 × 600; 37 KB
-
Newton z3 -z 2 iterate-2.jpg 800 × 600; 41 KB
-
Newton z3 -z 2 iterate-3.jpg 800 × 600; 43 KB
-
Newton z3 -z 2 iterate-4.jpg 800 × 600; 45 KB
-
Newton z3 -z 2 iterate-5.jpg 800 × 600; 48 KB
-
Newton z3 -z 2 iterate-6.jpg 800 × 600; 55 KB
-
Newtroot 1 0 0 0 0 m1.jpg 5,600 × 5,600; 7.39 MB
-
Newtroot 1 0 0 0 0 m1.png 1,655 × 1,655; 1,003 KB
-
Pole-order9-infin.png 558 × 508; 110 KB
-
Principle branch of arg on plane.png 280 × 279; 19 KB
-
Product Log.jpg 1,063 × 1,063; 213 KB
-
Q function complex plot plotted with Mathematica 13.1 ComplexPlot3D.svg 2,170 × 2,076; 3.89 MB
-
Q-Eulero.jpeg 600 × 600; 26 KB
-
Quadratic-function-z2-minus4z-minus2iz-plus5.jpg 543 × 540; 56 KB
-
Quadratic-function-z2-minus4z-plus2iz-plus5.jpg 543 × 540; 57 KB
-
Quadratic-function-z2-minus4z-plus5.jpg 543 × 540; 56 KB
-
Radial Basis Functions.webm 8.0 s, 1,054 × 720; 1.43 MB
-
Ramanujan Nundi Etu Atu by Vemuri Venkateswararao.pdf 1,275 × 1,650, 107 pages; 3.83 MB
-
Riemann Siegel Theta 1.jpg 1,043 × 1,043; 207 KB
-
Riemann Siegel Theta 2.jpg 1,066 × 1,066; 196 KB
-
Riemann Siegel Theta 3.jpg 854 × 854; 172 KB
-
Riemann Zeta.jpg 435 × 2,043; 202 KB
-
Riemann-Zeta-Detail.png 2,080 × 4,808; 3.22 MB
-
Riemann-Zeta-Func.png 1,320 × 1,752; 1.33 MB
-
Rogers400.png 2,552 × 2,560; 1.99 MB
-
RogersRamanujan400.png 2,560 × 2,552; 2.06 MB
-
Roots Poles Rational Functions.webm 15 s, 1,280 × 720; 4.7 MB
-
Roots Polynomials.webm 10 s, 720 × 720; 2.16 MB
-
Schramm-Loewner Evolution.png 1,024 × 1,024; 488 KB
-
Shefi z in range -10 to 10.png 2,048 × 2,043; 877 KB
-
Sin x^-1 in range -5 to 5.png 1,323 × 1,323; 364 KB
-
Sin x^-1 in range negative four fifths to four fifths.png 1,323 × 1,315; 488 KB
-
Sin x^-1 in range negative one tenths to one tenths.png 1,323 × 1,310; 752 KB
-
Sin(1overz).png 450 × 440; 96 KB
-
Sin(z).png 450 × 450; 57 KB
-
Tan(z).png 450 × 450; 48 KB
-
The binary logarithm function lg(z) plotted in the complex plane from -2-2i to 2+2i.svg 2,548 × 2,489; 4.25 MB
-
The cardinal cosecant function cscc(z) plotted in the complex plane from -2-2i to 2+2i.svg 2,548 × 2,488; 5.23 MB
-
The cardinal sine function sinc(z) plotted in the complex plane from -2-2i to 2+2i.svg 2,548 × 2,485; 3.68 MB
-
The cosecant function csc(z) plotted in the complex plane from -2-2i to 2+2i.svg 2,548 × 2,474; 4.78 MB
-
The cosine function cos(z) plotted in the complex plane from -2-2i to 2+2i.svg 2,548 × 2,488; 5.13 MB
-
The cotangent function cot(z) plotted in the complex plane from -2-2i to 2+2i.svg 2,548 × 2,464; 4.51 MB
-
The exponential function e^z plotted in the complex plane from -2-2i to 2+2i.svg 2,548 × 2,488; 3.7 MB
-
The hyperbolic cosecant function csch(z) plotted in the complex plane from -2-2i to 2+2i.svg 2,548 × 2,474; 4.59 MB
-
The hyperbolic cosine function cosh(z) plotted in the complex plane from -2-2i to 2+2i.svg 2,548 × 2,488; 5.84 MB
-
The hyperbolic secant function sech(z) plotted in the complex plane from -2-2i to 2+2i.svg 2,548 × 2,488; 5.09 MB
-
The hyperbolic sine function sinh(z) plotted in the complex plane from -2-2i to 2+2i.svg 2,548 × 2,488; 5.76 MB
-
The natural logarithm function ln(z) plotted in the complex plane from -2-2i to 2+2i.svg 2,548 × 2,488; 4.25 MB
-
The product logarithm Lambert W function plotted in the complex plane from -2-2i to 2+2i.svg 2,548 × 2,475; 3.89 MB
-
The secant function sec(z) plotted in the complex plane from -2-2i to 2+2i.svg 2,548 × 2,488; 5.01 MB
-
The sine function sin(z) plotted in the complex plane from -2-2i to 2+2i.svg 2,548 × 2,488; 4.83 MB
-
The tangent function tan(z) plotted in the complex plane from -2-2i to 2+2i.svg 2,548 × 2,488; 4.78 MB
-
Thumbnail-of-Riemann Zeta.png 180 × 212; 29 KB
-
Versine in complex plane.png 4,020 × 4,014; 1.89 MB
-
Voronin-3.png 418 × 2,011; 147 KB
-
Z over zminus1.jpg 853 × 853; 150 KB
-
Z+1+2i.png 450 × 450; 61 KB
-
Z+1.png 450 × 450; 63 KB
-
Z+3.png 450 × 450; 59 KB
-
Z2 over z2minus1.jpg 853 × 853; 162 KB
-
Z3 over z3minus1.jpg 853 × 853; 165 KB
-
Z3 over z5minus1.jpg 852 × 852; 195 KB
-
Z4 over z4minus1.jpg 855 × 855; 170 KB
-
Z4 over z5minus1.jpg 852 × 852; 185 KB
-
Z4minus02i over z4minus1.jpg 851 × 851; 167 KB
-
Z4plus005 over z4minus1.jpg 851 × 851; 168 KB
-
Z4plus1 over z4.jpg 855 × 855; 176 KB
-
Z4plus1 over z4minus005.jpg 851 × 851; 171 KB
-
Z4plus1 over z4minus1.jpg 850 × 850; 179 KB
-
Z5 over z5minus1.jpg 852 × 852; 168 KB
-
Z6 over z5minus1.jpg 854 × 854; 189 KB
-
Z7 over z5minus1.jpg 855 × 855; 206 KB
-
Z7 over z7minus1.jpg 854 × 854; 166 KB
-
Zeta(z).png 450 × 443; 102 KB
-
ZetaContour 01.svg 450 × 298; 69 KB
-
ZetaContour 02.svg 450 × 298; 67 KB
-
Z^-1.png 450 × 450; 69 KB
-
Z^2-1.png 450 × 443; 66 KB
-
Z^2.png 450 × 450; 75 KB
-
Z^3-1.png 450 × 443; 69 KB
-
Z^3-8.png 450 × 450; 75 KB
-
Z^3.png 450 × 450; 80 KB
-
Z^4.png 450 × 450; 84 KB
-
Z^7-z.png 450 × 450; 95 KB


