Category:Climate of Alaska
Jump to navigation
Jump to search
States of the United States: Alabama · Alaska · Arizona · Arkansas · California · Colorado · Connecticut · Delaware · Florida · Georgia · Hawaii · Idaho · Illinois · Indiana · Iowa · Kansas · Kentucky · Louisiana · Maine · Maryland · Massachusetts · Michigan · Minnesota · Mississippi · Missouri · Montana · Nebraska · Nevada · New Hampshire · New Jersey · New Mexico · New York · North Carolina · North Dakota · Ohio · Oklahoma · Oregon · Pennsylvania · Rhode Island · South Carolina · South Dakota · Tennessee · Texas · Utah · Vermont · Virginia · Washington · West Virginia · Wisconsin · Wyoming – District of Columbia: Washington, D.C.
American Samoa · Puerto Rico · United States Virgin Islands
American Samoa · Puerto Rico · United States Virgin Islands
trends in the weather of the northernmost American state | |||||
| Upload media | |||||
| Instance of |
| ||||
|---|---|---|---|---|---|
| Subclass of | |||||
| Facet of | |||||
| Location |
| ||||
| |||||
Subcategories
This category has the following 7 subcategories, out of 7 total.
*
F
J
P
W
Media in category "Climate of Alaska"
The following 38 files are in this category, out of 38 total.
-
Accumulated Precipitation - CHICKEN, AK.svg 558 × 516; 111 KB
-
Accumulated Snowfall - CHICKEN, AK.svg 558 × 516; 112 KB
-
Ak precip extremes.png 702 × 270; 14 KB
-
Alaska climate regions USGS.gif 418 × 351; 17 KB
-
Alaska Köppen.png 6,600 × 7,200; 652 KB
-
Alaska Köppen.svg 900 × 990; 862 KB
-
Alaska rainfall map.jpg 1,610 × 993; 319 KB
-
Alaska vegetation and summer temperatures map.png 361 × 275; 18 KB
-
Alaskatemps.PNG 739 × 527; 21 KB
-
Climate Emergency Alaska State Capitol 422.jpg 4,032 × 3,024; 1.95 MB
-
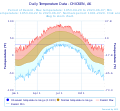
Daily Temperature Data - CHICKEN, AK.svg 558 × 516; 176 KB
-
Highest Min Temperature by Day for CHICKEN, AK.png 683 × 643; 55 KB
-
Homer, Alaska Mean Temperature (2019-04-2020-04).gif 491 × 703; 15 KB
-
Ketchikan, Alaska Mean Temperature (2019-04-2020-04).gif 491 × 703; 15 KB
-
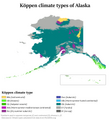
Köppen Climate Types Alaska.png 2,056 × 1,467; 338 KB
-
Lowest Max Temperature by Day for CHICKEN, AK.png 683 × 646; 57 KB
-
Monthly Climate Normals (1991-2020) - CHICKEN, AK.svg 558 × 516; 26 KB
-
Monthly Climate Normals (1991-2020) - DEADHORSE, AK.svg 558 × 516; 26 KB
-
Monthly Climate Normals (1991-2020) - DUTCH HARBOR, AK.svg 558 × 516; 27 KB
-
Monthly Climate Normals (1991-2020) - EAGLE AIRPORT, AK.svg 558 × 516; 26 KB
-
Monthly Climate Normals (1991-2020) - ILIAMNA AIRPORT, AK.svg 558 × 516; 26 KB
-
Monthly Climate Normals (1991-2020) - KALTAG AIRPORT, AK.svg 558 × 516; 26 KB
-
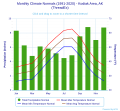
Monthly Climate Normals (1991-2020) - Kodiak Area, AK(ThreadEx).svg 558 × 516; 27 KB
-
Monthly Climate Normals (1991-2020) - MAIN BAY, AK.svg 558 × 516; 26 KB
-
Monthly Climate Normals (1991-2020) - NORTH POLE, AK.svg 558 × 516; 26 KB
-
Monthly Climate Normals (1991-2020) - PALMER AIRPORT, AK.svg 558 × 516; 27 KB
-
Monthly Climate Normals (1991-2020) - PALMER JOB CORPS,AK.svg 558 × 516; 27 KB
-
Monthly Climate Normals (1991-2020) - SAND POINT 1 ENE,AK.svg 558 × 516; 27 KB
-
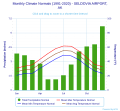
Monthly Climate Normals (1991-2020) - SELDOVIA AIRPORT,AK.svg 558 × 516; 26 KB
-
Monthly Climate Normals (1991-2020) - WHITTIER, AK.svg 604 × 533; 30 KB
-
Nak maxtemp extremes.png 652 × 476; 22 KB
-
Nak mintemp extremes.png 704 × 571; 37 KB
-
Saint Paul Island, Alaska Mean Temperature (2019-04-2020-04).gif 491 × 703; 15 KB
-
Service Change Notice 19-75.pdf 1,275 × 1,650, 2 pages; 44 KB
-
Southeast Alaska Köppen.png 6,000 × 7,081; 405 KB
-
Unalakleet, Alaska Mean Temperature (2019-04-2020-04).gif 491 × 703; 15 KB


