Category:Climate diagrams of England
Jump to navigation
Jump to search
Subcategories
This category has the following 2 subcategories, out of 2 total.
*
- Climate diagrams of Plymouth (2 F)
W
Media in category "Climate diagrams of England"
The following 9 files are in this category, out of 9 total.
-
 20190731 Central England Temperature (CET) (annual mean, beginning in 1659).png 3,323 × 1,351; 136 KB
-
 Beverley weather graph.png 640 × 480; 37 KB
-
 Central England Temperature and the Maunder Minimum.png 9,609 × 7,203; 299 KB
-
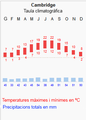 Climograma.png 248 × 347; 11 KB
-
 Eastbournejuly1911sunhours.png 6,667 × 3,750; 447 KB
-
 London-climate.png 526 × 377; 5 KB
-
 Meteorology; a chart of air pressure and temperature at Manc Wellcome V0025063.jpg 3,500 × 2,022; 3.75 MB
-
 Weymouth Climatic Graph.PNG 926 × 610; 18 KB
-
 Weymouth Climatic Graph.png 6,000 × 3,138; 5.94 MB


_(annual_mean,_beginning_in_1659).png)