Category:Climate diagrams W+L of Baden-Württemberg (English)
Jump to navigation
Jump to search
Federal states of Germany:
Subcategories
This category has only the following subcategory.
Media in category "Climate diagrams W+L of Baden-Württemberg (English)"
The following 117 files are in this category, out of 117 total.
-
 Climatediagram-metric-english-AlbstadtEbingen-Germany-1961-1990.png 1,000 × 685; 73 KB
-
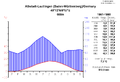 Climatediagram-metric-english-AlbstadtLautlingen-Germany-1961-1990.png 1,000 × 685; 72 KB
-
 Climatediagram-metric-english-AlbstadtOnstmettingen-Germany-1961-1990.png 1,000 × 685; 77 KB
-
 Climatediagram-metric-english-AulendorfSpiegler-Germany-1961-1990.png 1,000 × 685; 74 KB
-
 Climatediagram-metric-english-BadDuerrheim-Germany-1961-1990.png 1,000 × 685; 69 KB
-
 Climatediagram-metric-english-BadenBadenGeroldsau-Germany-1961-1990.png 1,000 × 685; 77 KB
-
 Climatediagram-metric-english-BadHerrenalb-Germany-1961-1990.png 1,000 × 685; 83 KB
-

-
 Climatediagram-metric-english-BadUrach-Germany-1961-1990.png 1,000 × 685; 74 KB
-
 Climatediagram-metric-english-BadWildbadCalmbach-Germany-1961-1990.png 1,000 × 685; 82 KB
-
 Climatediagram-metric-english-BadWildbadSommerberg-Germany-1961-1990.png 1,000 × 685; 88 KB
-
 Climatediagram-metric-english-BaiersbronnObertal-Germany-1961-1990.png 1,000 × 685; 92 KB
-
 Climatediagram-metric-english-Bonndorf-Germany-1961-1990.png 1,000 × 685; 74 KB
-
 Climatediagram-metric-english-BoxbergSeehof-Germany-1961-1990.png 1,000 × 685; 65 KB
-
 Climatediagram-metric-english-Buchen-Germany-1961-1990.png 1,000 × 685; 70 KB
-
 Climatediagram-metric-english-Buehlertal-Germany-1961-1990.png 1,000 × 685; 81 KB
-
 Climatediagram-metric-english-BuehlertalObertal-Germany-1961-1990.png 1,000 × 685; 85 KB
-
 Climatediagram-metric-english-CrailsheimIngersheim-Germany-1961-1990.png 1,000 × 685; 71 KB
-
 Climatediagram-metric-english-Dobel-Germany-1961-1990.png 1,000 × 685; 89 KB
-
 Climatediagram-metric-english-Donaueschingen-Germany-1961-1990.png 1,000 × 685; 72 KB
-
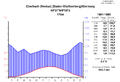 Climatediagram-metric-english-Eberbach-Germany-1961-1990.png 1,000 × 685; 76 KB
-
 Climatediagram-metric-english-Eimeldingen-Germany-1961-1990.png 1,000 × 685; 68 KB
-
 Climatediagram-metric-english-EllwangenRindelbach-Germany-1961-1990.png 1,000 × 685; 71 KB
-
 Climatediagram-metric-english-EmmendingenMundingen-Germany-1961-1990.png 1,000 × 685; 72 KB
-
 Climatediagram-metric-english-Engen-Germany-1961-1990.png 1,000 × 685; 67 KB
-
 Climatediagram-metric-english-EningenObererLindenhof-Germany-1961-1990.png 1,000 × 685; 75 KB
-
 Climatediagram-metric-english-Enzkloesterle-Germany-1961-1990.png 1,000 × 685; 88 KB
-
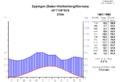 Climatediagram-metric-english-Eppingen-Germany-1961-1990.png 1,000 × 685; 67 KB
-
 Climatediagram-metric-english-EriskirchMariabrunn-Germany-1961-1990.png 1,000 × 685; 77 KB
-
 Climatediagram-metric-english-Eschbach-Germany-1961-1990.png 1,000 × 685; 66 KB
-
 Climatediagram-metric-english-FreiamtOttoschwanden-Germany-1961-1990.png 1,000 × 685; 73 KB
-
 Climatediagram-metric-english-FreiburgBreisgau-Germany-1961-1990.png 1,000 × 685; 74 KB
-
 Climatediagram-metric-english-FreiburgBreisgauHerdern-Germany-1961-1990.png 1,000 × 685; 75 KB
-
 Climatediagram-metric-english-Freudenstadt-Germany-1961-1990.png 1,000 × 685; 76 KB
-
 Climatediagram-metric-english-Friedenweiler-Germany-1961-1990.png 1,000 × 685; 82 KB
-
 Climatediagram-metric-english-Friedrichshafen-Germany-1961-1990.png 1,000 × 685; 75 KB
-
 Climatediagram-metric-english-Gschwend-Germany-1961-1990.png 1,000 × 685; 77 KB
-
 Climatediagram-metric-english-Hechingen-Germany-1961-1990.png 1,000 × 685; 71 KB
-
 Climatediagram-metric-english-Heidelberg-Germany-1961-1990.png 1,000 × 685; 66 KB
-
 Climatediagram-metric-english-Heidenheim-Germany-1961-1990.png 1,000 × 685; 72 KB
-
 Climatediagram-metric-english-Heilbronn-Germany-1961-1990.png 1,000 × 685; 67 KB
-
 Climatediagram-metric-english-Hinterzarten-Germany-1961-1990.png 1,000 × 685; 88 KB
-
 Climatediagram-metric-english-Hoechenschwand-Germany-1961-1990.png 1,000 × 685; 85 KB
-
 Climatediagram-metric-english-Hornisgrinde-Germany-1961-1990.png 1,000 × 685; 76 KB
-
 Climatediagram-metric-english-Hottingen-Germany-1961-1990.png 1,000 × 685; 87 KB
-
 Climatediagram-metric-english-IhringenLiliental-Germany-1961-1990.png 1,000 × 685; 70 KB
-
 Climatediagram-metric-english-Ingelfingen-Germany-1961-1990.png 1,000 × 685; 69 KB
-
 Climatediagram-metric-english-Isny-Germany-1961-1990.png 1,000 × 685; 88 KB
-
 Climatediagram-metric-english-JungholzKuehmoos-Germany-1961-1990.png 1,000 × 685; 84 KB
-
 Climatediagram-metric-english-Karlsruhe-Germany-1961-1990.png 1,000 × 685; 66 KB
-
 Climatediagram-metric-english-Klippeneck-Germany-1961-1990.png 1,000 × 685; 74 KB
-
 Climatediagram-metric-english-Koenigsfeld-Germany-1961-1990.png 1,000 × 685; 77 KB
-
 Climatediagram-metric-english-Konstanz-Germany-1961-1990.png 1,000 × 685; 71 KB
-
 Climatediagram-metric-english-Konstanzcity-Germany-1961-1990.png 1,000 × 685; 71 KB
-
 Climatediagram-metric-english-Laichingen-Germany-1961-1990.png 1,000 × 685; 74 KB
-

-
 Climatediagram-metric-english-LenningenSchopfloch-Germany-1961-1990.png 1,000 × 685; 77 KB
-
 Climatediagram-metric-english-Lenzkirch-Germany-1961-1990.png 1,000 × 685; 86 KB
-
 Climatediagram-metric-english-MainhardtZiegelbronn-Germany-1961-1990.png 1,000 × 685; 76 KB
-

-
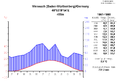
 Climatediagram-metric-english-Mannheim-Germany-1961-1990.png 1,000 × 685; 64 KB
-
 Climatediagram-metric-english-Meersburg-Germany-1961-1990.png 1,000 × 685; 73 KB
-
 Climatediagram-metric-english-Muellheim-Germany-1961-1990.png 1,000 × 685; 73 KB
-
 Climatediagram-metric-english-MuensingenApfelstetten-Germany-1961-1990.png 1,000 × 685; 76 KB
-
 Climatediagram-metric-english-Murrhardt-Germany-1961-1990.png 1,000 × 685; 80 KB
-
 Climatediagram-metric-english-Nagold-Germany-1961-1990.png 1,000 × 685; 72 KB
-
 Climatediagram-metric-english-Neudenau-Germany-1961-1990.png 1,000 × 685; 67 KB
-
 Climatediagram-metric-english-Niederstotzingen-Germany-1961-1990.png 1,000 × 685; 68 KB
-
 Climatediagram-metric-english-NuertingenOberensingen-Germany-1961-1990.png 1,000 × 685; 70 KB
-
 Climatediagram-metric-english-Oehringen-Germany-1961-1990.png 1,000 × 685; 69 KB
-
 Climatediagram-metric-english-Offenburg-Germany-1961-1990.png 1,000 × 685; 71 KB
-
 Climatediagram-metric-english-Ohlsbach-Germany-1961-1990.png 1,000 × 685; 74 KB
-
 Climatediagram-metric-english-PforzheimEutingen-Germany-1961-1990.png 1,000 × 685; 69 KB
-
 Climatediagram-metric-english-Pfullendorf-Germany-1961-1990.png 1,000 × 685; 71 KB
-
 Climatediagram-metric-english-RadolfzellMarkelfingen-Germany-1961-1990.png 1,000 × 685; 70 KB
-
 Climatediagram-metric-english-RheinauMemprechtshofen-Germany-1961-1990.png 1,000 × 685; 72 KB
-
 Climatediagram-metric-english-Rheinfelden-Germany-1961-1990.png 1,000 × 685; 72 KB
-
 Climatediagram-metric-english-RheinstettenForchheim-Germany-1961-1990.png 1,000 × 685; 69 KB
-
 Climatediagram-metric-english-Rottweil-Germany-1961-1990.png 1,000 × 685; 72 KB
-
 Climatediagram-metric-english-Rutesheim-Germany-1961-1990.png 1,000 × 685; 69 KB
-
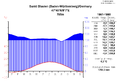 Climatediagram-metric-english-SanktBlasien-Germany-1961-1990.png 1,000 × 685; 77 KB
-

-
 Climatediagram-metric-english-SanktMaergen-Germany-1961-1990.png 1,000 × 685; 93 KB
-
 Climatediagram-metric-english-SchallstadtMengen-Germany-1961-1990.png 1,000 × 685; 69 KB
-
 Climatediagram-metric-english-SchemmerhofenIngerkingen-Germany-1961-1990.png 1,000 × 685; 69 KB
-
 Climatediagram-metric-english-Schluchsee-Germany-1961-1990.png 1,000 × 685; 91 KB
-
 Climatediagram-metric-english-Schoemberg-Germany-1961-1990.png 1,000 × 685; 80 KB
-
 Climatediagram-metric-english-SchopfheimEichen-Germany-1961-1990.png 1,000 × 685; 80 KB
-

-

-
 Climatediagram-metric-english-SigmaringenLaiz-Germany-1961-1990.png 1,000 × 685; 71 KB
-
 Climatediagram-metric-english-Stoetten-Germany-1961-1990.png 1,000 × 685; 80 KB
-
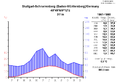
 Climatediagram-metric-english-Stuttgart-Germany-1961-1990.png 1,000 × 685; 66 KB
-
 Climatediagram-metric-english-StuttgartEchterdingen-Germany-1961-1990.png 1,000 × 685; 69 KB
-
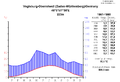
 Climatediagram-metric-english-StuttgartHohenheim-Germany-1961-1990.png 1,000 × 685; 67 KB
-
 Climatediagram-metric-english-StuttgartNeckarvalley-Germany-1961-1990.png 1,000 × 685; 67 KB
-
 Climatediagram-metric-english-StuttgartSchnarrenberg-Germany-1961-1990.png 1,000 × 685; 67 KB
-

-

-
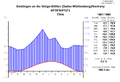
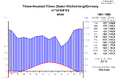 Climatediagram-metric-english-TitiseeNeustadtTitisee-Germany-1961-1990.png 1,000 × 685; 87 KB
-
 Climatediagram-metric-english-Todtmoos-Germany-1961-1990.png 1,000 × 685; 77 KB
-
 Climatediagram-metric-english-Triberg-Germany-1961-1990.png 1,000 × 685; 78 KB
-
 Climatediagram-metric-english-TribergKurpark-Germany-1961-1990.png 1,000 × 685; 92 KB
-
 Climatediagram-metric-english-Trochtelfingen-Germany-1961-1990.png 1,000 × 685; 73 KB
-
 Climatediagram-metric-english-Ueberlingen-Germany-1961-1990.png 1,000 × 685; 73 KB
-
 Climatediagram-metric-english-Ulm-Germany-1961-1990.png 1,000 × 685; 68 KB
-
 Climatediagram-metric-english-VillingenSchwenningen-Germany-1961-1990.png 1,000 × 685; 74 KB
-
 Climatediagram-metric-english-VogtsburgOberrotweil-Germany-1961-1990.png 1,000 × 685; 66 KB
-
 Climatediagram-metric-english-WaghaeuselKirrlach-Germany-1961-1990.png 1,000 × 685; 65 KB
-
 Climatediagram-metric-english-Waiblingen-Germany-1961-1990.png 1,000 × 685; 68 KB
-
 Climatediagram-metric-english-Waldshut-Germany-1961-1990.png 1,000 × 685; 77 KB
-
 Climatediagram-metric-english-Weingarten-Germany-1961-1990.png 1,000 × 685; 75 KB
-
 Climatediagram-metric-english-Weinsberg-Germany-1961-1990.png 1,000 × 685; 67 KB
-
 Climatediagram-metric-english-Weissach-Germany-1961-1990.png 1,000 × 685; 69 KB
-
 Climatediagram-metric-english-WertheimEichel-Germany-1961-1990.png 1,000 × 685; 68 KB
-
 Climatediagram-metric-english-Wolfach-Germany-1961-1990.png 1,000 × 685; 79 KB
-
 Climatediagram-metric-english-WutoeschingenOfteringen-Germany-1961-1990.png 1,000 × 685; 76 KB


