Category:Choropleth maps of the United States
Jump to navigation
Jump to search
Subcategories
This category has only the following subcategory.
Media in category "Choropleth maps of the United States"
The following 90 files are in this category, out of 90 total.
-
 100 Mile Footraces in the Contiguous United States, 2011 A.svg 1,150 × 718; 1,018 KB
-
 100 Mile Footraces in the Contiguous United States, 2011.svg 1,153 × 721; 457 KB
-
 American1346.gif 500 × 375; 16 KB
-
 Average electric percap.png 2,550 × 1,800; 429 KB
-
 Average electric prices.png 2,550 × 1,800; 434 KB
-
 Average energy percap.png 2,550 × 1,800; 431 KB
-
 Bad English la1.gif 500 × 375; 31 KB
-
 Black chicago1.png 500 × 375; 31 KB
-
 Black Hispanic Bivariate Map.png 3,116 × 1,950; 1.21 MB
-
 Black sf1.png 500 × 375; 21 KB
-
 Carbon per area.png 2,550 × 1,800; 405 KB
-
 Carbon per capita.png 2,550 × 1,800; 404 KB
-
 Census Bureau Czechs in the United States.gif 498 × 373; 13 KB
-
 Census Bureau English Ancestry in the United States.gif 500 × 375; 16 KB
-
 Census Bureau Scotch-Irish Ancestry in the United States.gif 500 × 375; 16 KB
-
 Census Bureau Scottish Americans in the United States.gif 498 × 373; 14 KB
-
 Census Bureau Welsh Ancestry in the United States.gif 500 × 375; 15 KB
-
 Ch3e3d.png 725 × 691; 262 KB
-
 Choropleth Map.png 615 × 467; 170 KB
-
 Craft Breweries Per Capita (US).png 1,100 × 680; 121 KB
-
 Craft Breweries Per Capita (US).svg 959 × 593; 107 KB
-
 Crisis Trends anxiety map August 2014.png 1,600 × 929; 170 KB
-
 Data on food deserts.png 1,034 × 556; 795 KB
-
 Distribution of Danish Americans according to 2000.gif 500 × 375; 15 KB
-
 Dutch1346.gif 500 × 375; 15 KB
-
 Electric pct Resid.png 2,550 × 1,800; 422 KB
-
 Electric pct Total.png 2,550 × 1,800; 417 KB
-
 Family inc sf1.gif 500 × 375; 20 KB
-
 French1346.gif 500 × 375; 15 KB
-
 German1346.gif 500 × 375; 16 KB
-
 Greek1346.gif 500 × 375; 16 KB
-
 House inc sf1.gif 500 × 375; 20 KB
-
 Hungarian1346.gif 500 × 375; 15 KB
-
 Illinois counties by race.svg 187 × 338; 23 KB
-
 Irish1346.gif 500 × 375; 16 KB
-
 Latino chicago1.gif 500 × 375; 30 KB
-
 Latino sf1.gif 500 × 375; 20 KB
-
 Lithuanian1346.gif 500 × 375; 14 KB
-
 Male earn sf1.gif 500 × 375; 17 KB
-
 Male sf1.gif 500 × 375; 19 KB
-

-
 Minimumleeftijd doodstraf vs.JPG 820 × 578; 63 KB
-
 Natural la1.gif 500 × 375; 31 KB
-
 Norwegian1346.gif 500 × 375; 15 KB
-
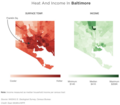 NPR HEAT GRAPH.png 1,296 × 1,136; 627 KB
-
 Other latino sj1.gif 500 × 375; 20 KB
-
 Overall Electrification.png 2,550 × 1,800; 417 KB
-
 Overall energy price.png 2,550 × 1,800; 429 KB
-
 Polish1346.gif 500 × 375; 15 KB
-
 Poverty sf1.gif 500 × 375; 20 KB
-
 Residential electric percap.png 2,550 × 1,800; 428 KB
-
 Residential electric prices.png 2,550 × 1,800; 432 KB
-
 Residential Electrification.png 2,550 × 1,800; 422 KB
-
 Residential Energy Consumption per Capita.png 2,550 × 1,800; 427 KB
-
 Residential Energy Price.png 2,550 × 1,800; 426 KB
-
 Russian1346.gif 500 × 375; 15 KB
-
 SlavePopulationUS1860.jpg 10,503 × 8,380; 15.5 MB
-
 Slovak1346.gif 500 × 375; 14 KB
-
 State electric generation.png 2,550 × 1,800; 426 KB
-
 State electric major renew.png 2,550 × 1,800; 381 KB
-
 State electric major.png 2,550 × 1,800; 391 KB
-
 State electric salient.png 2,550 × 1,800; 385 KB
-
 State energy production.png 2,550 × 1,800; 422 KB
-
 State imports.png 2,550 × 1,800; 398 KB
-
 State net electric import.png 2,550 × 1,800; 404 KB
-
 State net energy import.png 2,550 × 1,800; 392 KB
-
 Swedish1346.gif 500 × 375; 15 KB
-
 U.S. GDP by state 2008 (current dollars).jpg 590 × 530; 139 KB
-
 U.S. Presidential election margin, 2004-2016.png 3,169 × 2,146; 1.07 MB
-
 Unemploy sf1.gif 500 × 375; 19 KB
-
 United States Murder Rate (2017).svg 512 × 382; 168 KB
-
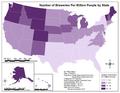 US Breweries Per One Million People By State 2012.pdf 1,650 × 1,275; 377 KB
-
 US GDP per capita by state 2010 (current dollars).svg 512 × 240; 64 KB
-
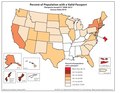 US Passport Holders as Peercent of Population by State.pdf 1,650 × 1,275; 248 KB
-
 US State Credit Ratings Fitch January 2017.svg 959 × 593; 32 KB
-
 US States by Agreeableness.svg 959 × 593; 29 KB
-
 US States by Conscientiousness.svg 959 × 593; 29 KB
-
 US States by Extraversion.svg 959 × 593; 29 KB
-
 US states by GDP per capita (nominal).PNG 945 × 583; 25 KB
-
 US States by Neuroticism.svg 959 × 593; 29 KB
-
 US States by Openness to Experience.svg 959 × 593; 29 KB
-
 US states by percent union members (2017).svg 959 × 593; 32 KB
-
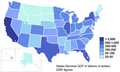 USA states nominal gdp 2005.PNG 960 × 580; 34 KB
-
 USA states nominal gdp.PNG 960 × 580; 36 KB
-
 Vs choropleet fout.PNG 1,589 × 1,083; 98 KB
-
 VS inwoners pmi2 met foute visuele rangorde kleur.PNG 1,022 × 652; 43 KB
-
 VS inwoners pmi2 met foute visuele rangorde zw w.PNG 1,022 × 652; 48 KB
-
 VS inwoners pmi2 met juiste visuele rangorde zw w choropleet.PNG 1,582 × 995; 91 KB
-
 VS inwoners pmi2 zonder rangorde is fout leeskaart.PNG 997 × 616; 48 KB
-
 White sf1.gif 500 × 375; 20 KB


.png)
.svg)


.jpg)


.svg)
.svg)


.PNG)


.svg)


