Category:Childbirth graphs
Jump to navigation
Jump to search
Media in category "Childbirth graphs"
The following 22 files are in this category, out of 22 total.
-
 1955-Grangettes-Pouponnière-Feuille d'observation-2.jpg 4,830 × 4,133; 6.84 MB
-
 Apgar score.png 954 × 842; 64 KB
-
 Birth weight chart 2.svg 376 × 264; 23 KB
-
 Birth weight chart.png 383 × 254; 71 KB
-
 Cost of Childbirth.jpg 1,319 × 799; 107 KB
-
 Episio-dechirures.jpg 1,950 × 388; 135 KB
-
 Geburten 1940 - 2011 Wennigsen.png 1,460 × 783; 29 KB
-
 GeburtsprobCH2006.png 1,017 × 525; 56 KB
-
 Graphique contractions accouchement.jpg 1,051 × 583; 33 KB
-
 Graphique pics douleur contractions.jpg 1,076 × 574; 36 KB
-
 Number of births 1972-2012, Norway.png 539 × 292; 81 KB
-
 Number of Births and Birthrate, Japan.svg 640 × 480; 8 KB
-
 Number of Births and Deaths, Japan.svg 640 × 480; 8 KB
-
 Premature Births in England and Wales 2011 (cropped).png 700 × 791; 42 KB
-
 Premature Births in England and Wales 2011.png 700 × 1,166; 65 KB
-
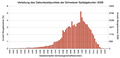 SpitalgeburtenCH2006.png 982 × 472; 49 KB
-
 Us births by mother's living situation.png 933 × 598; 30 KB
-
 US percent of births by age of mother and marital status in 1990.svg 750 × 560; 19 KB
-
 US percent of births by age of mother and marital status in 2000.svg 750 × 560; 19 KB
-
 US percent of births by age of mother and marital status in 2010.svg 750 × 560; 19 KB
-
 US percent of births by age of mother and marital status.svg 750 × 560; 18 KB
-
 出産時の母親の年齢階級別割合の推移.jpg 811 × 468; 73 KB


.png)


