Category:Animated maps of the world
Jump to navigation
Jump to search
Subcategories
This category has only the following subcategory.
C
- Animated maps of continents (36 F)
Media in category "Animated maps of the world"
The following 71 files are in this category, out of 71 total.
-
100 Years of ships.ogv 12 min 34 s, 1,620 × 1,080; 73.02 MB
-
World War II alliances animated map.gif 1,357 × 628; 104 KB
-
Altogether.gif 1,480 × 625; 243 KB
-
Carbonivores.ogv 25 s, 960 × 540; 4.68 MB
-
Carnabotnet geovideo lowres.gif 600 × 337; 2.33 MB
-
Cartog anim.gif 2,976 × 1,267; 10.89 MB
-
Chronologie Francophonie.gif 1,425 × 625; 458 KB
-
CO2 concentrations.ogv 20 s, 960 × 540; 2.49 MB
-
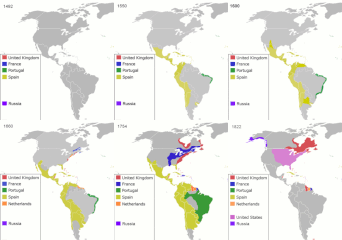
Colonisation2 (Americas cropped).gif 319 × 337; 124 KB
-
Colonisation2-de.gif 1,425 × 625; 256 KB
-
Colonisation2-it.gif 1,425 × 625; 99 KB
-
Colonisation2.gif 1,849 × 810; 2.08 MB
-
Continental Drift (740 million-to-Today).gif 1,814 × 1,020; 11.01 MB
-
COVID-19-outbreak-timeline.gif 1,194 × 606; 587 KB
-
Cpc-ncep-noaa z200anim 07JUN2012-06JUL2012.gif 538 × 305; 2.27 MB
-
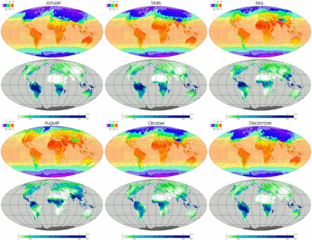
Earth Climate Swedish.gif 550 × 632; 1 MB
-
Earth Climate.gif 550 × 632; 875 KB
-
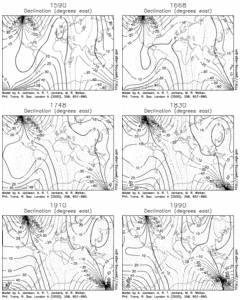
Earth Magnetic Field Declination from 1590 to 1990.gif 351 × 293; 3.25 MB
-
Earth-satellite-seasons.gif 540 × 270; 1.73 MB
-
French Empire evolution.gif 1,425 × 625; 146 KB
-
G2010-106 NPP ReportersPackage ipod lg.ogv 3 min 44 s, 400 × 226; 15 MB
-
Geozonen-animation.gif 800 × 434; 1.14 MB
-
Global Temperature Anomaly - slower-1000.gif 1,280 × 720; 19.74 MB
-
Global Temperature Anomaly - slower-200.gif 1,280 × 720; 19.75 MB
-
Global Temperature Anomaly - slower-2000.gif 1,280 × 720; 19.74 MB
-
Global Temperature Anomaly - slower-300.gif 1,280 × 720; 19.75 MB
-
Global Temperature Anomaly - slower-400.gif 1,280 × 720; 19.75 MB
-
Global Temperature Anomaly - slower-500.gif 1,280 × 720; 19.74 MB
-
Global Temperature Anomaly Kelvin.gif 1,280 × 720; 20.1 MB
-
Global Temperature Anomaly.gif 1,280 × 720; 19.77 MB
-
Global temperature changes.webm 37 s, 3,840 × 2,160; 60.66 MB
-
Google Street View timelapse additions.gif 845 × 426; 7.44 MB
-
Iceedgekils slow.gif 512 × 256; 448 KB
-
Iceedgekils.gif 512 × 256; 409 KB
-
Kuukauden keskilämpötila ympäri maailman.gif 550 × 340; 402 KB
-
LN member states animation.gif 1,425 × 625; 62 KB
-
MeanMonthlyP.gif 1,200 × 744; 1.09 MB
-
-
-
MONAMAPA.gif 700 × 525; 1.72 MB
-
MonthlyMeanT.gif 550 × 340; 405 KB
-
NDVI 1998.gif 360 × 286; 485 KB
-
Percentage of individuals using the Internet 1990-2014 HighQuality.gif 1,367 × 731; 770 KB
-
Population over Time.gif 1,344 × 626; 351 KB
-
Rank all.gif 1,315 × 708; 203 KB
-
Rank all2.gif 1,315 × 708; 278 KB
-
Rank all3.gif 1,315 × 708; 313 KB
-
Rank all4.gif 1,315 × 708; 178 KB
-
Rank antipoverty.gif 1,315 × 708; 334 KB
-
Rank climate.gif 1,315 × 708; 241 KB
-
Rank edu.gif 1,315 × 708; 325 KB
-
Rank humanaid.gif 1,315 × 708; 397 KB
-
Rank peacekeeping.gif 1,315 × 708; 390 KB
-
Rank policecoop.gif 1,315 × 708; 331 KB
-
Rank publichealth.gif 1,315 × 708; 393 KB
-
Rank terror.gif 1,315 × 708; 444 KB
-
Rank womenhcild.gif 1,315 × 708; 330 KB
-
Spread-of-printing.gif 1,400 × 725; 744 KB
-
Summer temperatures Northern Hemisphere 1955 to 2011.ogv 31 s, 960 × 540; 2.45 MB
-
Timed100kmsabertidisep2005.gif 1,000 × 625; 4.62 MB
-
UN member states animation.gif 1,336 × 767; 124 KB
-
Vehicles map 2001-2007.gif 800 × 359; 199 KB
-
Wikidata-geo-40d.gif 1,000 × 500; 864 KB
-
Wind vectors and monthly average CO2 concentrations in 2003.ogv 20 s, 960 × 540; 3.78 MB
-
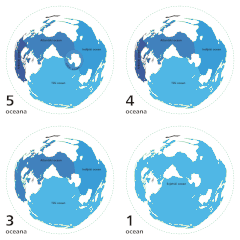
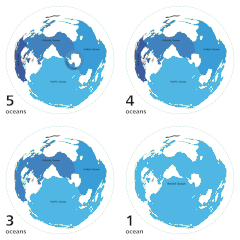
World ocean map hr.gif 500 × 500; 69 KB
-
World ocean map-fr.gif 500 × 500; 108 KB
-
World ocean map.gif 500 × 500; 68 KB
-
World War 1.gif 1,200 × 555; 456 KB
-
World-airline-routemap-2010.ogv 12 s, 1,024 × 1,024; 34.79 MB
-
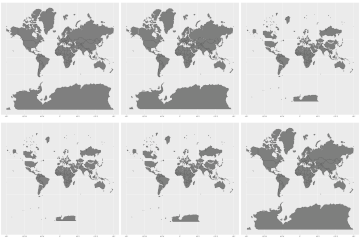
Worlds animate.gif 645 × 645; 542 KB


