Category:Animated maps of the United States
Jump to navigation
Jump to search
Media in category "Animated maps of the United States"
The following 51 files are in this category, out of 51 total.
-
% of Total Houses by US county, Built By Time Period, US Census.gif 1,554 × 902; 1.77 MB
-
15animation.gif 640 × 480; 8.51 MB
-
2006 800x506 us senate by party nov-2006 election.gif 800 × 506; 23 KB
-
2008 Democratic Primary Process Map Color Blindness Simulation.gif 431 × 247; 29 KB
-
Airqualityasian 2022 01.gif 720 × 545; 634 KB
-
AKsizemap.gif 396 × 180; 180 KB
-
American south animated map.gif 566 × 365; 32 KB
-
Animation Relief USA 2.gif 510 × 369; 325 KB
-
Animation relief USA.gif 171 × 151; 66 KB
-
CSA states evolution.gif 1,000 × 677; 245 KB
-
Dcmapanimated.gif 456 × 480; 23 KB
-
Derecho 08May09 mesonet 640x480.ogv 38 s, 640 × 480; 28.09 MB
-
Development of the United States, 1789 to 1959.gif 1,000 × 677; 4.75 MB
-
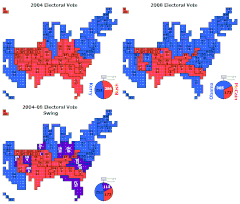
Electoral Vote Cartogram - 2004-2008 Swing.gif 895 × 762; 101 KB
-
Evolution of United States standard time zone boundaries.webm 29 s, 3,507 × 2,480; 4.58 MB
-
Exapnsion of Delta Upsilon.gif 1,144 × 707; 772 KB
-
January 2007 western US freeze.gif 303 × 420; 57 KB
-
January 4, 2022 0100 UTC outlook activity loop.gif 582 × 408; 128 KB
-
Kentucky Congressional Districts (1935-2021).gif 837 × 387; 30.63 MB
-
Loveland, Ohio, 1975 to 2024 in OpenHistoricalMap.webm 22 s, 3,456 × 2,158; 2.15 MB
-
Ma code history.gif 450 × 420; 40 KB
-
Map of NATO chronological.gif 743 × 284; 135 KB
-
Marriage amendment animation.gif 840 × 575; 103 KB
-
PercentOfUSPopInEachState.gif 1,513 × 983; 710 KB
-
PSKGrowth1910.gif 1,513 × 983; 2.83 MB
-
Q913672.gif 864 × 864; 832 KB
-
Rainbow Growth.gif 954 × 589; 298 KB
-
US states by date of statehood.gif 795 × 595; 108 KB
-
US states by date of statehood3.gif 795 × 595; 236 KB
-
Territorial evolution of San Jose, California, 1850–2022 in OpenHistoricalMap.webm 17 s, 2,880 × 1,800; 1,015 KB
-
Territorial evolution of San Jose, California, 1950–1969 in OpenHistoricalMap.webm 23 s, 2,880 × 1,800; 1.74 MB
-
Timeline of the Brown Tree Snake's Travel Across Guam.gif 428 × 500; 119 KB
-
Unemployment rate map of the united states.gif 757 × 403; 35.53 MB
-
United States 1860-1870.gif 787 × 483; 49 KB
-
United States evolution small.gif 747 × 479; 3.96 MB
-
United States evolution.gif 1,000 × 641; 5.1 MB
-
United States governors.gif 1,600 × 989; 613 KB
-
United States installed wind power capacity animation 561px.gif 561 × 421; 1.44 MB
-
US house membership 1854-1898.gif 570 × 370; 91 KB
-
US house membership 1900-1948.gif 570 × 370; 88 KB
-
US house membership 1950-2006.gif 570 × 370; 112 KB
-
US LGBT civil rights animation.gif 1,239 × 680; 1.39 MB
-
US Presidential Elections Dem GOP 1952-2004.gif 580 × 340; 55 KB
-
US Presidential Elections Dem GOP.gif 506 × 313; 111 KB
-
US Slave Free 1789-1861.gif 774 × 468; 100 KB
-
US states by date of statehood.svg 959 × 593; 123 KB
-
US states by date of statehood2.gif 800 × 650; 129 KB
-
USA Territorial Growth small.gif 431 × 287; 456 KB
-
USA territorial growth.gif 921 × 573; 2.01 MB
-
Utah Territory evolution animation - August 2011.gif 1,000 × 786; 158 KB


