Category:Alluvial diagrams
Jump to navigation
Jump to search
type of flow diagram originally developed to represent changes in network structure over time  | |||||
| Upload media | |||||
| Subclass of | |||||
|---|---|---|---|---|---|
| |||||
Media in category "Alluvial diagrams"
The following 15 files are in this category, out of 15 total.
-
 2022 Alaska United States Senate election preference flow.svg 512 × 341; 13 KB
-

-

-
 Braddon 2018 by-election - Sankey preference flow.svg 1,509 × 544; 181 KB
-
 Eden-Monaro by-election 2020 preference flows.png 6,330 × 1,167; 689 KB
-
 Google Analytics visitor path flow diagram.png 1,440 × 900; 148 KB
-
 Hydroelectric Sankey Diagram.png 598 × 595; 14 KB
-
 London clickstream.png 1,624 × 810; 159 KB
-
 NeuroAlluvial2001-2007-691x273.png 5,806 × 2,311; 204 KB
-
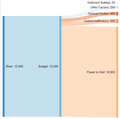
 New10000.png 598 × 598; 15 KB
-

-
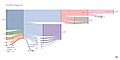 Sankey Diagram - Income Statement.jpg 4,536 × 2,268; 453 KB
-
 Sankey Diagram of Colorado River Water Use.jpg 1,992 × 1,072; 228 KB
-
 Tijuana River Valley Change in Habitat Types.jpg 2,550 × 3,300; 1,020 KB
-
 Typical Signal Schedule and Traffic Flow Diagram, North-South across Market (1929).png 4,408 × 2,732; 3.32 MB


.png)