Category:Air pollution maps
Jump to navigation
Jump to search
Subcategories
This category has the following 2 subcategories, out of 2 total.
N
- Nitrogen dioxide maps (71 F)
Media in category "Air pollution maps"
The following 19 files are in this category, out of 19 total.
-

-
 103973-Map3.3-map-Report-Annual-Annual-mean-PM2.5-concentrations-2017 v2-it.svg 7,135 × 5,625; 5.5 MB
-
 AirQual wideSTILL.0630.jpg 2,560 × 1,920; 591 KB
-
 Annual average concentration of PM2.5 in 2010 in Europe.gif 2,422 × 1,866; 2.97 MB
-
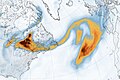 Atlanticsmoketransport geos5 2023177 lrg.jpg 2,283 × 1,522; 1.7 MB
-
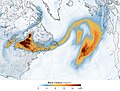 Atlanticsmoketransport geos5 2023177.jpg 720 × 545; 304 KB
-
 Carbon per area.png 2,550 × 1,800; 405 KB
-
 Carte du réseau de détecteurs luftdaten.png 898 × 863; 1 MB
-
 Clerbaux-spring NASA-f.jpg 1,200 × 900; 446 KB
-
 CO2 Brazil.png 757 × 743; 66 KB
-

-
 Emission of pollutants into air from stationary sources, Belarus, 2013.png 2,000 × 1,785; 712 KB
-
 Intensitée du Smog sur base des données du 13 Septembre 2020.png 6,900 × 4,275; 4.33 MB
-
 Mapaemissions.png 1,030 × 990; 822 KB
-

-
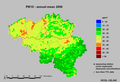 Pm10 anmean 06.png 700 × 476; 194 KB
-
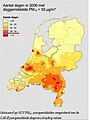 PM10 dagoverschrijdingen in Nederland 2006.jpg 720 × 960; 67 KB
-
 PM10 in Europe.png 2,049 × 1,598; 213 KB
-
 The Dark Side of Carbon.jpg 4,096 × 4,096; 628 KB


_et_la_pollution_particulaire_Paris_London_2019.png)


