Category:Agricultural charts
Jump to navigation
Jump to search

- See also
Subcategories
This category has the following 2 subcategories, out of 2 total.
C
- Cereals production trends (25 F)
Media in category "Agricultural charts"
The following 76 files are in this category, out of 76 total.
-
 Aminosyror havre.PNG 484 × 375; 13 KB
-
 Animal gestation calendar for horses - cows - sheep - pigs -1917.tiff 538 × 339; 1.06 MB
-
 Annual Crops of Cranberries, 1907 to 1935, American Cranberry Exchange.png 1,464 × 1,018; 1.28 MB
-
 Barley production and consumption in Spain, UE and worldwide (1961-2003).JPG 1,751 × 1,602; 288 KB
-
 Barley S-curve.png 623 × 465; 17 KB
-
 Biotechpflanzen2.png 680 × 493; 136 KB
-
 Bread and wheat prices in Spain (1984-2008).JPG 1,812 × 636; 137 KB
-
 C-N.png 951 × 613; 13 KB
-
 CAP2004beneficiaries.png 714 × 468; 9 KB
-
 CAPspendingbysector.png 611 × 382; 24 KB
-
 Clune2016 food lca-de.svg 1,000 × 800; 49 KB
-
 Clune2016 food lca.svg 1,000 × 800; 49 KB
-
 Comparison Chart.jpg 792 × 549; 44 KB
-
 Durchschnittliche Ernteverluste.PNG 818 × 531; 51 KB
-
 Estadística de la producció dels principals cereals (Catalunya).png 839 × 301; 58 KB
-
 Estadística de la producció dels principals cereals (món).png 839 × 305; 50 KB
-
 Estadística de la producció dels principals cereals a Espanya.png 839 × 303; 65 KB
-
 Estadística de la superfície cultivada de cereals a Catalunya.png 841 × 298; 35 KB
-
 Estadística de la superfície cultivada de cereals a Espanya.png 839 × 299; 36 KB
-
 Estadística de la superfície cultivada de cereals al món.png 837 × 293; 33 KB
-

-

-
 Estadística dels rendiments dels principals cereals a Catalunya.png 841 × 300; 57 KB
-
 Estadística dels rendiments dels principals cereals a Espanya.png 839 × 302; 55 KB
-
 Estadística dels rendiments dels principals cereals al món.png 839 × 302; 48 KB
-
 EUFarm-eng.svg 703 × 523; 145 KB
-
 Evolució de la producció i del consum de Cereals a Espanya.png 841 × 263; 54 KB
-

-
 Evolució de la producció i del consum de Cereals al món.png 841 × 239; 34 KB
-
 FarmlandinEU2.gif 658 × 460; 17 KB
-
 Fertilizer prices.webp 5,273 × 1,464; 198 KB
-
 Global Aquaculture Producers in Terms of Quantity.png 2,878 × 1,079; 56 KB
-
 Global Aquaculture Top Ten Producers in Terms of Growth.png 1,614 × 905; 75 KB
-
 Greenhouses by country.jpg 660 × 376; 51 KB
-
 Gyapottermelés.svg 573 × 440; 8 KB
-
 HawaiiSugarcaneAcres.png 470 × 319; 10 KB
-
 HawaiiSugarcaneTons.png 471 × 317; 11 KB
-
 Innehåll havre.PNG 527 × 265; 7 KB
-
 Kaffeeernten 2007–2017.png 1,043 × 912; 127 KB
-
 Legeleistung-Deutschland.png 1,420 × 271; 36 KB
-
 Maize production and consumption in Spain, UE and worldwide (1961-2003).jpg 1,755 × 1,600; 560 KB
-
 Mapa de Procesos del Ciclo de Vida de los Blueberries.png 1,281 × 1,332; 200 KB
-
 Millet production and consumption in Spain, EU and worldwide (1961-2003).jpg 1,746 × 1,602; 380 KB
-
 Oats production and consumption in Spain, UE and worldwide (1961-2003).JPG 1,753 × 1,600; 260 KB
-
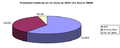
 Producción mundial maíz 2001 B.png 980 × 543; 3 KB
-
 Producenci ryżu..png 508 × 289; 9 KB
-
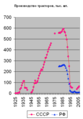 Production of tractors USSR Russia.png 347 × 498; 9 KB
-
 Pêra Rocha, Diagramme.PNG 729 × 384; 21 KB
-
 Rice production and consumption in Spain, UE and worldwide (1961-2003).jpg 1,751 × 1,601; 438 KB
-
 Rye production and consumption in Spain, UE and worldwide (1961-2003).JPG 1,756 × 1,602; 299 KB
-
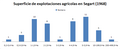 Segart superficie 1968.png 687 × 283; 7 KB
-
 Segart superficie porcentaje 1968.png 642 × 429; 15 KB
-
 Sorghum production and consumption in Spain, EU and worldwide (1961-2003).jpg 1,792 × 1,624; 378 KB
-
 Spotřeba hovězího masa.png 800 × 566; 42 KB
-
 Sugarcane S-curve.png 623 × 465; 16 KB
-
 Tea production in South Korea 1.svg 618 × 394; 36 KB
-
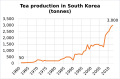 Tea production in South Korea.svg 618 × 405; 41 KB
-
 Tiernutzung getötete Tiere (Nutztiere, Jagdwild, Versuchstiere) Deutschland 2017.png 3,333 × 2,354; 277 KB
-
 Top 10 Countrys, Palm Oil Production 2013.jpeg 1,426 × 600; 48 KB
-
 Tryptofan havre.PNG 533 × 287; 8 KB
-
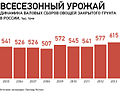 Vegetables in greenhouses in Russia.jpg 660 × 533; 81 KB
-
 Vins en Corse.png 557 × 224; 23 KB
-
 Výroba hovězího masa.png 800 × 566; 76 KB
-
 Wheat production and consumption in Spain, UE and worldwide (1961-2003).JPG 1,812 × 1,654; 310 KB
-
 Wheat yields in developing countries 1951-2004.png 655 × 548; 7 KB
-
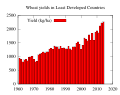 Wheat yields in Least Developed Countries.svg 700 × 550; 20 KB
-
 Winterrapsertrag Deutschland 2002-2006.jpg 472 × 267; 34 KB
-
 World barley production and profitability (1960-2005).JPG 1,752 × 544; 94 KB
-
 World maize production and profitability (1960-2005).jpg 1,755 × 545; 152 KB
-
 World millets production and profitability (1960-2005).jpg 1,734 × 542; 127 KB
-
 World oats production and profitability (1960-2005).JPG 1,749 × 543; 83 KB
-
 World rice production and profitability (1960-2005).jpg 1,755 × 544; 135 KB
-
 World rye production and profitability (1960-2005).jpg 1,755 × 544; 96 KB
-
 World sorghum production and profitability (1960-2005).jpg 1,742 × 538; 133 KB
-
 World triticale production and profitability (1960-2005).jpg 1,758 × 545; 134 KB
-
 World wheat production and profitability (1960-2005).JPG 1,815 × 565; 85 KB


.JPG)


.jpg)

.jpg)
.JPG)


.jpg)
.JPG)

.jpg)


_Deutschland_2017.png)


.JPG)


.JPG)
.png)
.png)
.JPG)
.jpg)
.jpg)
.JPG)
.jpg)
.jpg)
.jpg)
.jpg)
.JPG)