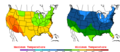
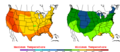
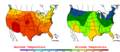
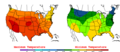
Category:2021 NCEP daily max-min temperature maps
Jump to navigation
Jump to search
Media in category "2021 NCEP daily max-min temperature maps"
The following 200 files are in this category, out of 225 total.
(previous page) (next page)-
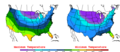
 2021-01-01 Color Max-min Temperature Map NOAA.png 800 × 350; 13 KB
-
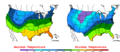
 2021-01-02 Color Max-min Temperature Map NOAA.png 800 × 350; 15 KB
-
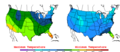
 2021-01-03 Color Max-min Temperature Map NOAA.png 800 × 350; 15 KB
-
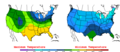
 2021-01-04 Color Max-min Temperature Map NOAA.png 800 × 350; 14 KB
-
 2021-01-05 Color Max-min Temperature Map NOAA.png 800 × 350; 14 KB
-
 2021-01-06 Color Max-min Temperature Map NOAA.png 800 × 350; 15 KB
-
 2021-01-07 Color Max-min Temperature Map NOAA.png 800 × 350; 14 KB
-
 2021-01-08 Color Max-min Temperature Map NOAA.png 800 × 350; 15 KB
-
 2021-01-09 Color Max-min Temperature Map NOAA.png 800 × 350; 15 KB
-
 2021-01-10 Color Max-min Temperature Map NOAA.png 800 × 350; 15 KB
-
 2021-01-11 Color Max-min Temperature Map NOAA.png 800 × 350; 15 KB
-
 2021-01-12 Color Max-min Temperature Map NOAA.png 800 × 350; 15 KB
-
 2021-01-13 Color Max-min Temperature Map NOAA.png 800 × 350; 15 KB
-
 2021-01-14 Color Max-min Temperature Map NOAA.png 800 × 350; 15 KB
-
 2021-01-15 Color Max-min Temperature Map NOAA.png 800 × 350; 15 KB
-
 2021-01-16 Color Max-min Temperature Map NOAA.png 800 × 350; 15 KB
-
 2021-01-17 Color Max-min Temperature Map NOAA.png 800 × 350; 14 KB
-
 2021-01-18 Color Max-min Temperature Map NOAA.png 800 × 350; 15 KB
-
 2021-01-19 Color Max-min Temperature Map NOAA.png 800 × 350; 15 KB
-
 2021-01-20 Color Max-min Temperature Map NOAA.png 800 × 350; 15 KB
-
 2021-01-21 Color Max-min Temperature Map NOAA.png 800 × 350; 15 KB
-
 2021-01-22 Color Max-min Temperature Map NOAA.png 800 × 350; 15 KB
-
 2021-01-23 Color Max-min Temperature Map NOAA.png 800 × 350; 15 KB
-
 2021-01-24 Color Max-min Temperature Map NOAA.png 800 × 350; 15 KB
-
 2021-01-25 Color Max-min Temperature Map NOAA.png 800 × 350; 15 KB
-
 2021-01-26 Color Max-min Temperature Map NOAA.png 800 × 350; 15 KB
-
 2021-01-27 Color Max-min Temperature Map NOAA.png 800 × 350; 15 KB
-
 2021-01-28 Color Max-min Temperature Map NOAA.png 800 × 350; 15 KB
-
 2021-01-29 Color Max-min Temperature Map NOAA.png 800 × 350; 14 KB
-
 2021-01-30 Color Max-min Temperature Map NOAA.png 800 × 350; 14 KB
-
 2021-01-31 Color Max-min Temperature Map NOAA.png 800 × 350; 14 KB
-
 2021-02-01 Color Max-min Temperature Map NOAA.png 800 × 350; 15 KB
-
 2021-02-02 Color Max-min Temperature Map NOAA.png 800 × 350; 14 KB
-
 2021-02-03 Color Max-min Temperature Map NOAA.png 800 × 350; 14 KB
-
 2021-02-04 Color Max-min Temperature Map NOAA.png 800 × 350; 15 KB
-
 2021-02-05 Color Max-min Temperature Map NOAA.png 800 × 350; 15 KB
-
 2021-02-06 Color Max-min Temperature Map NOAA.png 800 × 350; 15 KB
-
 2021-02-07 Color Max-min Temperature Map NOAA.png 800 × 350; 15 KB
-
 2021-02-08 Color Max-min Temperature Map NOAA.png 800 × 350; 16 KB
-
 2021-02-09 Color Max-min Temperature Map NOAA.png 800 × 350; 16 KB
-
 2021-02-10 Color Max-min Temperature Map NOAA.png 800 × 350; 16 KB
-
 2021-02-11 Color Max-min Temperature Map NOAA.png 800 × 350; 16 KB
-
 2021-02-12 Color Max-min Temperature Map NOAA.png 800 × 350; 16 KB
-
 2021-02-13 Color Max-min Temperature Map NOAA.png 800 × 350; 15 KB
-
 2021-02-14 Color Max-min Temperature Map NOAA.png 800 × 350; 15 KB
-
 2021-02-15 Color Max-min Temperature Map NOAA.png 800 × 350; 15 KB
-
 2021-02-16 Color Max-min Temperature Map NOAA.png 800 × 350; 15 KB
-
 2021-02-17 Color Max-min Temperature Map NOAA.png 800 × 350; 15 KB
-
 2021-02-18 Color Max-min Temperature Map NOAA.png 800 × 350; 15 KB
-
 2021-02-19 Color Max-min Temperature Map NOAA.png 800 × 350; 15 KB
-
 2021-02-20 Color Max-min Temperature Map NOAA.png 800 × 350; 15 KB
-
 2021-02-21 Color Max-min Temperature Map NOAA.png 800 × 350; 15 KB
-
 2021-02-22 Color Max-min Temperature Map NOAA.png 800 × 350; 15 KB
-
 2021-02-23 Color Max-min Temperature Map NOAA.png 800 × 350; 14 KB
-
 2021-02-24 Color Max-min Temperature Map NOAA.png 800 × 350; 15 KB
-
 2021-02-25 Color Max-min Temperature Map NOAA.png 800 × 350; 15 KB
-
 2021-02-26 Color Max-min Temperature Map NOAA.png 800 × 350; 15 KB
-
 2021-02-27 Color Max-min Temperature Map NOAA.png 800 × 350; 15 KB
-
 2021-02-28 Color Max-min Temperature Map NOAA.png 800 × 350; 15 KB
-
 2021-03-01 Color Max-min Temperature Map NOAA.png 800 × 350; 15 KB
-
 2021-03-02 Color Max-min Temperature Map NOAA.png 800 × 350; 15 KB
-
 2021-03-03 Color Max-min Temperature Map NOAA.png 800 × 350; 14 KB
-
 2021-03-04 Color Max-min Temperature Map NOAA.png 800 × 350; 14 KB
-
 2021-03-05 Color Max-min Temperature Map NOAA.png 800 × 350; 15 KB
-
 2021-03-06 Color Max-min Temperature Map NOAA.png 800 × 350; 14 KB
-
 2021-03-07 Color Max-min Temperature Map NOAA.png 800 × 350; 14 KB
-
 2021-03-08 Color Max-min Temperature Map NOAA.png 800 × 350; 14 KB
-
 2021-03-09 Color Max-min Temperature Map NOAA.png 800 × 350; 14 KB
-
 2021-03-10 Color Max-min Temperature Map NOAA.png 800 × 350; 15 KB
-
 2021-03-11 Color Max-min Temperature Map NOAA.png 800 × 350; 15 KB
-
 2021-03-12 Color Max-min Temperature Map NOAA.png 800 × 350; 15 KB
-
 2021-03-13 Color Max-min Temperature Map NOAA.png 800 × 350; 15 KB
-
 2021-03-14 Color Max-min Temperature Map NOAA.png 800 × 350; 15 KB
-
 2021-03-15 Color Max-min Temperature Map NOAA.png 800 × 350; 14 KB
-
 2021-03-16 Color Max-min Temperature Map NOAA.png 800 × 350; 14 KB
-
 2021-03-17 Color Max-min Temperature Map NOAA.png 800 × 350; 14 KB
-
 2021-03-18 Color Max-min Temperature Map NOAA.png 800 × 350; 15 KB
-
 2021-03-19 Color Max-min Temperature Map NOAA.png 800 × 350; 15 KB
-
 2021-03-20 Color Max-min Temperature Map NOAA.png 800 × 350; 14 KB
-
 2021-03-21 Color Max-min Temperature Map NOAA.png 800 × 350; 14 KB
-
 2021-03-22 Color Max-min Temperature Map NOAA.png 800 × 350; 14 KB
-
 2021-03-31 Color Max-min Temperature Map NOAA.png 800 × 350; 15 KB
-
 2021-04-01 Color Max-min Temperature Map NOAA.png 800 × 350; 15 KB
-
 2021-04-02 Color Max-min Temperature Map NOAA.png 800 × 350; 15 KB
-
 2021-04-03 Color Max-min Temperature Map NOAA.png 800 × 350; 14 KB
-
 2021-04-04 Color Max-min Temperature Map NOAA.png 800 × 350; 14 KB
-
 2021-04-05 Color Max-min Temperature Map NOAA.png 800 × 350; 14 KB
-
 2021-04-06 Color Max-min Temperature Map NOAA.png 800 × 350; 15 KB
-
 2021-04-07 Color Max-min Temperature Map NOAA.png 800 × 350; 15 KB
-
 2021-04-08 Color Max-min Temperature Map NOAA.png 800 × 350; 14 KB
-
 2021-04-09 Color Max-min Temperature Map NOAA.png 800 × 350; 15 KB
-
 2021-04-10 Color Max-min Temperature Map NOAA.png 800 × 350; 15 KB
-
 2021-04-11 Color Max-min Temperature Map NOAA.png 800 × 350; 14 KB
-
 2021-04-12 Color Max-min Temperature Map NOAA.png 800 × 350; 15 KB
-
 2021-04-13 Color Max-min Temperature Map NOAA.png 800 × 350; 15 KB
-
 2021-04-14 Color Max-min Temperature Map NOAA.png 800 × 350; 15 KB
-
 2021-04-15 Color Max-min Temperature Map NOAA.png 800 × 350; 15 KB
-
 2021-04-16 Color Max-min Temperature Map NOAA.png 800 × 350; 15 KB
-
 2021-04-17 Color Max-min Temperature Map NOAA.png 800 × 350; 15 KB
-
 2021-04-18 Color Max-min Temperature Map NOAA.png 800 × 350; 15 KB
-
 2021-04-19 Color Max-min Temperature Map NOAA.png 800 × 350; 14 KB
-
 2021-04-20 Color Max-min Temperature Map NOAA.png 800 × 350; 15 KB
-
 2021-04-21 Color Max-min Temperature Map NOAA.png 800 × 350; 15 KB
-
 2021-04-22 Color Max-min Temperature Map NOAA.png 800 × 350; 15 KB
-
 2021-04-23 Color Max-min Temperature Map NOAA.png 800 × 350; 14 KB
-
 2021-04-24 Color Max-min Temperature Map NOAA.png 800 × 350; 14 KB
-
 2021-04-25 Color Max-min Temperature Map NOAA.png 800 × 350; 14 KB
-
 2021-04-26 Color Max-min Temperature Map NOAA.png 800 × 350; 15 KB
-
 2021-04-27 Color Max-min Temperature Map NOAA.png 800 × 350; 14 KB
-
 2021-04-28 Color Max-min Temperature Map NOAA.png 800 × 350; 15 KB
-
 2021-04-29 Color Max-min Temperature Map NOAA.png 800 × 350; 15 KB
-
 2021-04-30 Color Max-min Temperature Map NOAA.png 800 × 350; 14 KB
-
 2021-05-01 Color Max-min Temperature Map NOAA.png 800 × 350; 15 KB
-
 2021-05-02 Color Max-min Temperature Map NOAA.png 800 × 350; 14 KB
-
 2021-05-03 Color Max-min Temperature Map NOAA.png 800 × 350; 14 KB
-
 2021-05-04 Color Max-min Temperature Map NOAA.png 800 × 350; 15 KB
-
 2021-05-05 Color Max-min Temperature Map NOAA.png 800 × 350; 15 KB
-
 2021-05-06 Color Max-min Temperature Map NOAA.png 800 × 350; 15 KB
-
 2021-05-07 Color Max-min Temperature Map NOAA.png 800 × 350; 14 KB
-
 2021-05-08 Color Max-min Temperature Map NOAA.png 800 × 350; 15 KB
-
 2021-05-09 Color Max-min Temperature Map NOAA.png 800 × 350; 15 KB
-
 2021-05-10 Color Max-min Temperature Map NOAA.png 800 × 350; 15 KB
-
 2021-05-11 Color Max-min Temperature Map NOAA.png 800 × 350; 15 KB
-
 2021-05-12 Color Max-min Temperature Map NOAA.png 800 × 350; 15 KB
-
 2021-05-13 Color Max-min Temperature Map NOAA.png 800 × 350; 14 KB
-
 2021-05-14 Color Max-min Temperature Map NOAA.png 800 × 350; 14 KB
-
 2021-05-15 Color Max-min Temperature Map NOAA.png 800 × 350; 14 KB
-
 2021-05-16 Color Max-min Temperature Map NOAA.png 800 × 350; 14 KB
-
 2021-05-17 Color Max-min Temperature Map NOAA.png 800 × 350; 14 KB
-
 2021-05-18 Color Max-min Temperature Map NOAA.png 800 × 350; 14 KB
-
 2021-05-19 Color Max-min Temperature Map NOAA.png 800 × 350; 14 KB
-
 2021-05-20 Color Max-min Temperature Map NOAA.png 800 × 350; 14 KB
-
 2021-05-21 Color Max-min Temperature Map NOAA.png 800 × 350; 14 KB
-
 2021-05-22 Color Max-min Temperature Map NOAA.png 800 × 350; 15 KB
-
 2021-05-23 Color Max-min Temperature Map NOAA.png 800 × 350; 14 KB
-
 2021-05-24 Color Max-min Temperature Map NOAA.png 800 × 350; 14 KB
-
 2021-05-25 Color Max-min Temperature Map NOAA.png 800 × 350; 14 KB
-
 2021-05-26 Color Max-min Temperature Map NOAA.png 800 × 350; 14 KB
-
 2021-05-27 Color Max-min Temperature Map NOAA.png 800 × 350; 15 KB
-
 2021-05-28 Color Max-min Temperature Map NOAA.png 800 × 350; 14 KB
-
 2021-05-29 Color Max-min Temperature Map NOAA.png 800 × 350; 15 KB
-
 2021-05-30 Color Max-min Temperature Map NOAA.png 800 × 350; 15 KB
-
 2021-05-31 Color Max-min Temperature Map NOAA.png 800 × 350; 14 KB
-
 2021-06-01 Color Max-min Temperature Map NOAA.png 800 × 350; 14 KB
-
 2021-06-02 Color Max-min Temperature Map NOAA.png 800 × 350; 14 KB
-
 2021-06-03 Color Max-min Temperature Map NOAA.png 800 × 350; 14 KB
-
 2021-06-04 Color Max-min Temperature Map NOAA.png 800 × 350; 14 KB
-
 2021-06-05 Color Max-min Temperature Map NOAA.png 800 × 350; 14 KB
-
 2021-06-06 Color Max-min Temperature Map NOAA.png 800 × 350; 14 KB
-
 2021-06-07 Color Max-min Temperature Map NOAA.png 800 × 350; 14 KB
-
 2021-06-08 Color Max-min Temperature Map NOAA.png 800 × 350; 14 KB
-
 2021-06-09 Color Max-min Temperature Map NOAA.png 800 × 350; 14 KB
-
 2021-06-10 Color Max-min Temperature Map NOAA.png 800 × 350; 14 KB
-
 2021-06-11 Color Max-min Temperature Map NOAA.png 800 × 350; 14 KB
-
 2021-06-12 Color Max-min Temperature Map NOAA.png 800 × 350; 14 KB
-
 2021-06-13 Color Max-min Temperature Map NOAA.png 800 × 350; 14 KB
-
 2021-06-14 Color Max-min Temperature Map NOAA.png 800 × 350; 14 KB
-
 2021-06-15 Color Max-min Temperature Map NOAA.png 800 × 350; 14 KB
-
 2021-06-16 Color Max-min Temperature Map NOAA.png 800 × 350; 14 KB
-
 2021-06-17 Color Max-min Temperature Map NOAA.png 800 × 350; 14 KB
-
 2021-06-18 Color Max-min Temperature Map NOAA.png 800 × 350; 14 KB
-
 2021-06-19 Color Max-min Temperature Map NOAA.png 800 × 350; 14 KB
-
 2021-06-20 Color Max-min Temperature Map NOAA.png 800 × 350; 14 KB
-
 2021-06-21 Color Max-min Temperature Map NOAA.png 800 × 350; 14 KB
-
 2021-06-22 Color Max-min Temperature Map NOAA.png 800 × 350; 15 KB
-
 2021-06-23 Color Max-min Temperature Map NOAA.png 800 × 350; 14 KB
-
 2021-06-24 Color Max-min Temperature Map NOAA.png 800 × 350; 14 KB
-
 2021-06-25 Color Max-min Temperature Map NOAA.png 800 × 350; 14 KB
-
 2021-06-26 Color Max-min Temperature Map NOAA.png 800 × 350; 14 KB
-
 2021-06-27 Color Max-min Temperature Map NOAA.png 800 × 350; 14 KB
-
 2021-06-28 Color Max-min Temperature Map NOAA.png 800 × 350; 14 KB
-
 2021-06-29 Color Max-min Temperature Map NOAA.png 800 × 350; 14 KB
-
 2021-06-30 Color Max-min Temperature Map NOAA.png 800 × 350; 14 KB
-
 2021-07-01 Color Max-min Temperature Map NOAA.png 800 × 350; 14 KB
-
 2021-07-02 Color Max-min Temperature Map NOAA.png 800 × 350; 14 KB
-
 2021-07-03 Color Max-min Temperature Map NOAA.png 800 × 350; 14 KB
-
 2021-07-04 Color Max-min Temperature Map NOAA.png 800 × 350; 14 KB
-
 2021-07-05 Color Max-min Temperature Map NOAA.png 800 × 350; 14 KB
-
 2021-07-06 Color Max-min Temperature Map NOAA.png 800 × 350; 14 KB
-
 2021-07-07 Color Max-min Temperature Map NOAA.png 800 × 350; 14 KB
-
 2021-07-08 Color Max-min Temperature Map NOAA.png 800 × 350; 14 KB
-
 2021-07-09 Color Max-min Temperature Map NOAA.png 800 × 350; 14 KB
-
 2021-07-10 Color Max-min Temperature Map NOAA.png 800 × 350; 14 KB
-
 2021-07-11 Color Max-min Temperature Map NOAA.png 800 × 350; 14 KB
-
 2021-07-12 Color Max-min Temperature Map NOAA.png 800 × 350; 14 KB
-
 2021-07-13 Color Max-min Temperature Map NOAA.png 800 × 350; 14 KB
-
 2021-07-14 Color Max-min Temperature Map NOAA.png 800 × 350; 14 KB
-
 2021-07-15 Color Max-min Temperature Map NOAA.png 800 × 350; 14 KB
-
 2021-07-16 Color Max-min Temperature Map NOAA.png 800 × 350; 14 KB
-
 2021-07-17 Color Max-min Temperature Map NOAA.png 800 × 350; 14 KB
-
 2021-07-18 Color Max-min Temperature Map NOAA.png 800 × 350; 14 KB
-
 2021-07-19 Color Max-min Temperature Map NOAA.png 800 × 350; 14 KB
-
 2021-07-20 Color Max-min Temperature Map NOAA.png 800 × 350; 14 KB
-
 2021-07-21 Color Max-min Temperature Map NOAA.png 800 × 350; 14 KB
-
 2021-07-22 Color Max-min Temperature Map NOAA.png 800 × 350; 14 KB
-
 2021-07-23 Color Max-min Temperature Map NOAA.png 800 × 350; 14 KB
-
 2021-07-24 Color Max-min Temperature Map NOAA.png 800 × 350; 14 KB
-
 2021-07-25 Color Max-min Temperature Map NOAA.png 800 × 350; 14 KB
-
 2021-07-26 Color Max-min Temperature Map NOAA.png 800 × 350; 14 KB
-
 2021-07-27 Color Max-min Temperature Map NOAA.png 800 × 350; 14 KB


