Category:2013 NCEP weather maps
Jump to navigation
Jump to search
Subcategories
This category has the following 19 subcategories, out of 19 total.
- NCEP weather maps for March 2013 (155 F)
- NCEP weather maps for April 2013 (150 F)
- NCEP weather maps for May 2013 (155 F)
- NCEP weather maps for June 2013 (150 F)
- NCEP weather maps for July 2013 (155 F)
M
P
S
W
Media in category "2013 NCEP weather maps"
The following 200 files are in this category, out of 243 total.
(previous page) (next page)-
 2013 week 01 Daily Weather Map color summary NOAA.pdf 1,275 × 1,650, 16 pages; 21.43 MB
-
 2013 week 01 Daily Weather Map summary NOAA.pdf 1,275 × 1,650, 16 pages; 25.03 MB
-
 2013 week 02 Daily Weather Map color summary NOAA.pdf 1,275 × 1,650, 16 pages; 23.08 MB
-
 2013 week 02 Daily Weather Map summary NOAA.pdf 1,275 × 1,650, 16 pages; 26.56 MB
-
 2013 week 03 Daily Weather Map color summary NOAA.pdf 1,275 × 1,650, 16 pages; 20.2 MB
-
 2013 week 03 Daily Weather Map summary NOAA.pdf 1,275 × 1,650, 16 pages; 23.8 MB
-
 2013 week 04 Daily Weather Map color summary NOAA.pdf 1,275 × 1,650, 16 pages; 20.02 MB
-
 2013 week 04 Daily Weather Map summary NOAA.pdf 1,275 × 1,650, 16 pages; 23.6 MB
-
 2013 week 05 Daily Weather Map color summary NOAA.pdf 1,275 × 1,650, 16 pages; 23.48 MB
-
 2013 week 05 Daily Weather Map summary NOAA.pdf 1,275 × 1,650, 16 pages; 27.01 MB
-
 2013 week 06 Daily Weather Map color summary NOAA.pdf 1,275 × 1,650, 16 pages; 20.67 MB
-
 2013 week 06 Daily Weather Map summary NOAA.pdf 1,275 × 1,650, 16 pages; 24.38 MB
-
 2013 week 07 Daily Weather Map color summary NOAA.pdf 1,275 × 1,650, 16 pages; 21.36 MB
-
 2013 week 07 Daily Weather Map summary NOAA.pdf 1,275 × 1,650, 16 pages; 24.95 MB
-
 2013 week 08 Daily Weather Map color summary NOAA.pdf 1,275 × 1,650, 16 pages; 22.73 MB
-
 2013 week 08 Daily Weather Map summary NOAA.pdf 1,275 × 1,650, 16 pages; 26.09 MB
-
 2013 week 09 Daily Weather Map color summary NOAA.pdf 1,275 × 1,650, 16 pages; 20.61 MB
-
 2013 week 09 Daily Weather Map summary NOAA.pdf 1,275 × 1,650, 16 pages; 24.19 MB
-
 2013 week 10 Daily Weather Map color summary NOAA.pdf 1,275 × 1,650, 16 pages; 21.21 MB
-
 2013 week 10 Daily Weather Map summary NOAA.pdf 1,275 × 1,650, 16 pages; 24.63 MB
-
 2013 week 11 Daily Weather Map color summary NOAA.pdf 1,275 × 1,650, 16 pages; 20.22 MB
-
 2013 week 11 Daily Weather Map summary NOAA.pdf 1,275 × 1,650, 16 pages; 23.78 MB
-
 2013 week 12 Daily Weather Map color summary NOAA.pdf 1,275 × 1,650, 16 pages; 22.39 MB
-
 2013 week 12 Daily Weather Map summary NOAA.pdf 1,275 × 1,650, 16 pages; 25.95 MB
-
 2013 week 13 Daily Weather Map color summary NOAA.pdf 1,275 × 1,650, 16 pages; 18.04 MB
-
 2013 week 13 Daily Weather Map summary NOAA.pdf 1,275 × 1,650, 16 pages; 21.46 MB
-
 2013 week 14 Daily Weather Map color summary NOAA.pdf 1,275 × 1,650, 16 pages; 20.61 MB
-
 2013 week 14 Daily Weather Map summary NOAA.pdf 1,275 × 1,650, 16 pages; 24.11 MB
-
 2013 week 15 Daily Weather Map color summary NOAA.pdf 1,275 × 1,650, 16 pages; 22.35 MB
-
 2013 week 15 Daily Weather Map summary NOAA.pdf 1,275 × 1,650, 16 pages; 25.8 MB
-
 2013 week 16 Daily Weather Map color summary NOAA.pdf 1,275 × 1,650, 16 pages; 22.24 MB
-
 2013 week 16 Daily Weather Map summary NOAA.pdf 1,275 × 1,650, 16 pages; 25.74 MB
-
 2013 week 17 Daily Weather Map color summary NOAA.pdf 1,275 × 1,650, 16 pages; 17.85 MB
-
 2013 week 17 Daily Weather Map summary NOAA.pdf 1,275 × 1,650, 16 pages; 21.35 MB
-
 2013 week 18 Daily Weather Map color summary NOAA.pdf 1,275 × 1,650, 16 pages; 19.18 MB
-
 2013 week 18 Daily Weather Map summary NOAA.pdf 1,275 × 1,650, 16 pages; 22.59 MB
-
 2013 week 19 Daily Weather Map color summary NOAA.pdf 1,275 × 1,650, 16 pages; 19.6 MB
-
 2013 week 19 Daily Weather Map summary NOAA.pdf 1,275 × 1,650, 16 pages; 23.04 MB
-
 2013 week 20 Daily Weather Map color summary NOAA.pdf 1,275 × 1,650, 16 pages; 19.08 MB
-
 2013 week 20 Daily Weather Map summary NOAA.pdf 1,275 × 1,650, 16 pages; 22.51 MB
-
 2013 week 21 Daily Weather Map color summary NOAA.pdf 1,275 × 1,650, 16 pages; 21.2 MB
-
 2013 week 21 Daily Weather Map summary NOAA.pdf 1,275 × 1,650, 16 pages; 24.63 MB
-
 2013 week 22 Daily Weather Map color summary NOAA.pdf 1,275 × 1,650, 16 pages; 21.12 MB
-
 2013 week 22 Daily Weather Map summary NOAA.pdf 1,275 × 1,650, 16 pages; 24.53 MB
-
 2013 week 23 Daily Weather Map color summary NOAA.pdf 1,275 × 1,650, 16 pages; 19.53 MB
-
 2013 week 23 Daily Weather Map summary NOAA.pdf 1,275 × 1,650, 16 pages; 22.97 MB
-
 2013 week 24 Daily Weather Map color summary NOAA.pdf 1,275 × 1,650, 16 pages; 19.76 MB
-
 2013 week 24 Daily Weather Map summary NOAA.pdf 1,275 × 1,650, 16 pages; 23.07 MB
-
 2013 week 25 Daily Weather Map color summary NOAA.pdf 1,275 × 1,650, 16 pages; 19.66 MB
-
 2013 week 25 Daily Weather Map summary NOAA.pdf 1,275 × 1,650, 16 pages; 23.06 MB
-
 2013 week 26 Daily Weather Map color summary NOAA.pdf 1,275 × 1,650, 16 pages; 20.56 MB
-
 2013 week 26 Daily Weather Map summary NOAA.pdf 1,275 × 1,650, 16 pages; 24.1 MB
-
 2013 week 27 Daily Weather Map color summary NOAA.pdf 1,275 × 1,650, 16 pages; 19.42 MB
-
 2013 week 27 Daily Weather Map summary NOAA.pdf 1,275 × 1,650, 16 pages; 22.75 MB
-
 2013 week 28 Daily Weather Map color summary NOAA.pdf 1,275 × 1,650, 16 pages; 20 MB
-
 2013 week 28 Daily Weather Map summary NOAA.pdf 1,275 × 1,650, 16 pages; 23.39 MB
-
 2013 week 29 Daily Weather Map color summary NOAA.pdf 1,275 × 1,650, 16 pages; 20.02 MB
-
 2013 week 29 Daily Weather Map summary NOAA.pdf 1,275 × 1,650, 16 pages; 23.28 MB
-
 2013 week 30 Daily Weather Map color summary NOAA.pdf 1,275 × 1,650, 16 pages; 20.37 MB
-
 2013 week 30 Daily Weather Map summary NOAA.pdf 1,275 × 1,650, 16 pages; 23.79 MB
-
 2013 week 31 Daily Weather Map color summary NOAA.pdf 1,275 × 1,650, 16 pages; 20.53 MB
-
 2013 week 31 Daily Weather Map summary NOAA.pdf 1,275 × 1,650, 16 pages; 23.92 MB
-
 2013 week 32 Daily Weather Map color summary NOAA.pdf 1,275 × 1,650, 16 pages; 20.22 MB
-
 2013 week 32 Daily Weather Map summary NOAA.pdf 1,275 × 1,650, 16 pages; 23.53 MB
-
 2013 week 33 Daily Weather Map color summary NOAA.pdf 1,275 × 1,650, 16 pages; 18.62 MB
-
 2013 week 33 Daily Weather Map summary NOAA.pdf 1,275 × 1,650, 16 pages; 22.1 MB
-
 2013 week 34 Daily Weather Map color summary NOAA.pdf 1,275 × 1,650, 16 pages; 18.38 MB
-
 2013 week 34 Daily Weather Map summary NOAA.pdf 1,275 × 1,650, 16 pages; 21.79 MB
-
 2013 week 35 Daily Weather Map color summary NOAA.pdf 1,275 × 1,650, 16 pages; 19.51 MB
-
 2013 week 35 Daily Weather Map summary NOAA.pdf 1,275 × 1,650, 16 pages; 23.04 MB
-
 2013 week 36 Daily Weather Map color summary NOAA.pdf 1,275 × 1,650, 16 pages; 19.32 MB
-
 2013 week 36 Daily Weather Map summary NOAA.pdf 1,275 × 1,650, 16 pages; 22.79 MB
-
 2013 week 37 Daily Weather Map color summary NOAA.pdf 1,275 × 1,650, 16 pages; 19.54 MB
-
 2013 week 37 Daily Weather Map summary NOAA.pdf 1,275 × 1,650, 16 pages; 23.04 MB
-
 2013 week 38 Daily Weather Map color summary NOAA.pdf 1,275 × 1,650, 16 pages; 20.45 MB
-
 2013 week 38 Daily Weather Map summary NOAA.pdf 1,275 × 1,650, 16 pages; 23.77 MB
-
 2013 week 39 Daily Weather Map color summary NOAA.pdf 1,275 × 1,650, 16 pages; 18.25 MB
-
 2013 week 39 Daily Weather Map summary NOAA.pdf 1,275 × 1,650, 16 pages; 21.77 MB
-
 2013 week 40 Daily Weather Map color summary NOAA.pdf 1,275 × 1,650, 16 pages; 18.61 MB
-
 2013 week 40 Daily Weather Map summary NOAA.pdf 1,275 × 1,650, 16 pages; 22.04 MB
-
 2013 week 41 Daily Weather Map color summary NOAA.pdf 1,275 × 1,650, 16 pages; 17.9 MB
-
 2013 week 41 Daily Weather Map summary NOAA.pdf 1,275 × 1,650, 16 pages; 21.44 MB
-
 2013 week 42 Daily Weather Map color summary NOAA.pdf 1,275 × 1,650, 16 pages; 19.5 MB
-
 2013 week 42 Daily Weather Map summary NOAA.pdf 1,275 × 1,650, 16 pages; 22.44 MB
-
 2013 week 43 Daily Weather Map color summary NOAA.pdf 1,275 × 1,650, 16 pages; 16.94 MB
-
 2013 week 43 Daily Weather Map summary NOAA.pdf 1,275 × 1,650, 16 pages; 20.09 MB
-
 2013 week 44 Daily Weather Map color summary NOAA.pdf 1,275 × 1,650, 16 pages; 19.85 MB
-
 2013 week 44 Daily Weather Map summary NOAA.pdf 1,275 × 1,650, 16 pages; 22.94 MB
-
 2013 week 45 Daily Weather Map color summary NOAA.pdf 1,275 × 1,650, 16 pages; 19.45 MB
-
 2013 week 45 Daily Weather Map summary NOAA.pdf 1,275 × 1,650, 16 pages; 22.42 MB
-
 2013 week 46 Daily Weather Map color summary NOAA.pdf 1,275 × 1,650, 16 pages; 18.15 MB
-
 2013 week 46 Daily Weather Map summary NOAA.pdf 1,275 × 1,650, 16 pages; 21.75 MB
-
 2013 week 47 Daily Weather Map color summary NOAA.pdf 1,275 × 1,650, 16 pages; 21.31 MB
-
 2013 week 47 Daily Weather Map summary NOAA.pdf 1,275 × 1,650, 16 pages; 24.24 MB
-
 2013 week 48 Daily Weather Map color summary NOAA.pdf 1,275 × 1,650, 16 pages; 18.52 MB
-
 2013 week 48 Daily Weather Map summary NOAA.pdf 1,275 × 1,650, 16 pages; 21.74 MB
-
 2013 week 49 Daily Weather Map color summary NOAA.pdf 1,275 × 1,650, 16 pages; 22.93 MB
-
 2013 week 49 Daily Weather Map summary NOAA.pdf 1,275 × 1,650, 16 pages; 25.95 MB
-
 2013 week 50 Daily Weather Map color summary NOAA.pdf 1,275 × 1,650, 16 pages; 21.31 MB
-
 2013 week 50 Daily Weather Map summary NOAA.pdf 1,275 × 1,650, 16 pages; 24.4 MB
-
 2013 week 51 Daily Weather Map color summary NOAA.pdf 1,275 × 1,650, 16 pages; 21.15 MB
-
 2013 week 51 Daily Weather Map summary NOAA.pdf 1,275 × 1,650, 16 pages; 24.36 MB
-
 2013 week 52 Daily Weather Map color summary NOAA.pdf 1,275 × 1,650, 16 pages; 20.28 MB
-
 2013 week 52 Daily Weather Map summary NOAA.pdf 1,275 × 1,650, 16 pages; 23.43 MB
-
 2013-05-01 24-hr Precipitation Map NOAA.png 1,000 × 710; 27 KB
-
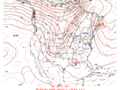
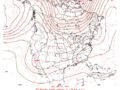
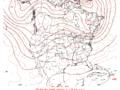
 2013-05-01 500-Millibar Height Contour Map NOAA.png 1,040 × 780; 49 KB
-
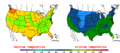
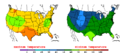
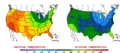
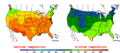
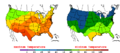
 2013-05-01 Color Max-min Temperature Map NOAA.png 800 × 350; 13 KB
-
 2013-05-01 Max-min Temperature Map NOAA.png 1,000 × 710; 28 KB
-
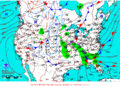
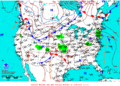
 2013-05-01 Surface Weather Map NOAA.png 1,088 × 783; 73 KB
-
 2013-05-02 24-hr Precipitation Map NOAA.png 1,000 × 710; 27 KB
-
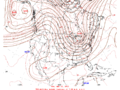
 2013-05-02 500-Millibar Height Contour Map NOAA.png 1,040 × 780; 51 KB
-
 2013-05-02 Color Max-min Temperature Map NOAA.png 800 × 350; 13 KB
-
 2013-05-02 Max-min Temperature Map NOAA.png 1,000 × 710; 28 KB
-
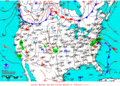
 2013-05-02 Surface Weather Map NOAA.png 1,088 × 783; 74 KB
-
 2013-05-03 24-hr Precipitation Map NOAA.png 1,000 × 710; 27 KB
-
 2013-05-03 500-Millibar Height Contour Map NOAA.png 1,040 × 780; 50 KB
-
 2013-05-03 Color Max-min Temperature Map NOAA.png 800 × 350; 13 KB
-
 2013-05-03 Max-min Temperature Map NOAA.png 1,000 × 710; 28 KB
-
 2013-05-03 Surface Weather Map NOAA.png 1,088 × 783; 76 KB
-
 2013-05-04 24-hr Precipitation Map NOAA.png 1,000 × 710; 26 KB
-
 2013-05-04 500-Millibar Height Contour Map NOAA.png 1,040 × 780; 49 KB
-
 2013-05-04 Color Max-min Temperature Map NOAA.png 800 × 350; 13 KB
-
 2013-05-04 Max-min Temperature Map NOAA.png 1,000 × 710; 28 KB
-
 2013-05-04 Surface Weather Map NOAA.png 1,088 × 783; 73 KB
-
 2013-05-05 24-hr Precipitation Map NOAA.png 1,000 × 710; 26 KB
-
 2013-05-05 500-Millibar Height Contour Map NOAA.png 1,040 × 780; 48 KB
-
 2013-05-05 Color Max-min Temperature Map NOAA.png 800 × 350; 13 KB
-
 2013-05-05 Max-min Temperature Map NOAA.png 1,000 × 710; 28 KB
-
 2013-05-05 Surface Weather Map NOAA.png 1,088 × 783; 72 KB
-
 2013-05-06 24-hr Precipitation Map NOAA.png 1,000 × 710; 26 KB
-
 2013-05-06 500-Millibar Height Contour Map NOAA.png 1,040 × 780; 47 KB
-
 2013-05-06 Color Max-min Temperature Map NOAA.png 800 × 350; 12 KB
-
 2013-05-06 Max-min Temperature Map NOAA.png 1,000 × 710; 28 KB
-
 2013-05-06 Surface Weather Map NOAA.png 1,088 × 783; 71 KB
-
 2013-05-07 24-hr Precipitation Map NOAA.png 1,000 × 710; 27 KB
-
 2013-05-07 500-Millibar Height Contour Map NOAA.png 1,040 × 780; 47 KB
-
 2013-05-07 Color Max-min Temperature Map NOAA.png 800 × 350; 12 KB
-
 2013-05-07 Max-min Temperature Map NOAA.png 1,000 × 710; 28 KB
-
 2013-05-07 Surface Weather Map NOAA.png 1,088 × 783; 67 KB
-
 2013-05-08 24-hr Precipitation Map NOAA.png 1,000 × 710; 27 KB
-
 2013-05-08 500-Millibar Height Contour Map NOAA.png 1,040 × 780; 49 KB
-
 2013-05-08 Color Max-min Temperature Map NOAA.png 800 × 350; 12 KB
-
 2013-05-08 Max-min Temperature Map NOAA.png 1,000 × 710; 27 KB
-
 2013-05-08 Surface Weather Map NOAA.png 1,088 × 783; 67 KB
-
 2013-05-09 24-hr Precipitation Map NOAA.png 1,000 × 710; 27 KB
-
 2013-05-09 500-Millibar Height Contour Map NOAA.png 1,040 × 780; 49 KB
-
 2013-05-09 Color Max-min Temperature Map NOAA.png 800 × 350; 12 KB
-
 2013-05-09 Max-min Temperature Map NOAA.png 1,000 × 710; 28 KB
-
 2013-05-09 Surface Weather Map NOAA.png 1,088 × 783; 69 KB
-
 2013-05-10 24-hr Precipitation Map NOAA.png 1,000 × 710; 28 KB
-
 2013-05-10 500-Millibar Height Contour Map NOAA.png 1,040 × 780; 49 KB
-
 2013-05-10 Color Max-min Temperature Map NOAA.png 800 × 350; 12 KB
-
 2013-05-10 Max-min Temperature Map NOAA.png 1,000 × 710; 28 KB
-
 2013-05-10 Surface Weather Map NOAA.png 1,088 × 783; 73 KB
-
 2013-05-11 24-hr Precipitation Map NOAA.png 1,000 × 710; 28 KB
-
 2013-05-11 500-Millibar Height Contour Map NOAA.png 1,040 × 780; 51 KB
-
 2013-05-11 Color Max-min Temperature Map NOAA.png 800 × 350; 13 KB
-
 2013-05-11 Max-min Temperature Map NOAA.png 1,000 × 710; 28 KB
-
 2013-05-11 Surface Weather Map NOAA.png 1,088 × 783; 71 KB
-
 2013-05-12 24-hr Precipitation Map NOAA.png 1,000 × 710; 28 KB
-
 2013-05-12 500-Millibar Height Contour Map NOAA.png 1,040 × 780; 52 KB
-
 2013-05-12 Color Max-min Temperature Map NOAA.png 800 × 350; 12 KB
-
 2013-05-12 Max-min Temperature Map NOAA.png 1,000 × 710; 28 KB
-
 2013-05-12 Surface Weather Map NOAA.png 1,088 × 783; 72 KB
-
 2013-05-13 24-hr Precipitation Map NOAA.png 1,000 × 710; 26 KB
-
 2013-05-13 500-Millibar Height Contour Map NOAA.png 1,040 × 780; 52 KB
-
 2013-05-13 Color Max-min Temperature Map NOAA.png 800 × 350; 13 KB
-
 2013-05-13 Max-min Temperature Map NOAA.png 1,000 × 710; 28 KB
-
 2013-05-13 Surface Weather Map NOAA.png 1,088 × 783; 71 KB
-
 2013-05-14 24-hr Precipitation Map NOAA.png 1,000 × 710; 26 KB
-
 2013-05-14 500-Millibar Height Contour Map NOAA.png 1,040 × 780; 49 KB
-
 2013-05-14 Color Max-min Temperature Map NOAA.png 800 × 350; 12 KB
-
 2013-05-14 Max-min Temperature Map NOAA.png 1,000 × 710; 28 KB
-
 2013-05-14 Surface Weather Map NOAA.png 1,088 × 783; 70 KB
-
 2013-05-15 24-hr Precipitation Map NOAA.png 1,000 × 710; 27 KB
-
 2013-05-15 500-Millibar Height Contour Map NOAA.png 1,040 × 780; 47 KB
-
 2013-05-15 Color Max-min Temperature Map NOAA.png 800 × 350; 12 KB
-
 2013-05-15 Max-min Temperature Map NOAA.png 1,000 × 710; 28 KB
-
 2013-05-15 Surface Weather Map NOAA.png 1,088 × 783; 71 KB
-
 2013-05-16 24-hr Precipitation Map NOAA.png 1,000 × 710; 28 KB
-
 2013-05-16 500-Millibar Height Contour Map NOAA.png 1,040 × 780; 46 KB
-
 2013-05-16 Color Max-min Temperature Map NOAA.png 800 × 350; 12 KB
-
 2013-05-16 Max-min Temperature Map NOAA.png 1,000 × 710; 27 KB
-
 2013-05-16 Surface Weather Map NOAA.png 1,088 × 783; 69 KB
-
 2013-05-17 24-hr Precipitation Map NOAA.png 1,000 × 710; 27 KB
-
 2013-05-17 500-Millibar Height Contour Map NOAA.png 1,040 × 780; 47 KB
-
 2013-05-17 Color Max-min Temperature Map NOAA.png 800 × 350; 12 KB
-
 2013-05-17 Max-min Temperature Map NOAA.png 1,000 × 710; 28 KB
-
 2013-05-17 Surface Weather Map NOAA.png 1,088 × 783; 68 KB
-
 2013-05-18 24-hr Precipitation Map NOAA.png 1,000 × 710; 27 KB
-
 2013-05-18 500-Millibar Height Contour Map NOAA.png 1,040 × 780; 46 KB
-
 2013-05-18 Color Max-min Temperature Map NOAA.png 800 × 350; 12 KB
-
 2013-05-18 Max-min Temperature Map NOAA.png 1,000 × 710; 28 KB
-
 2013-05-18 Surface Weather Map NOAA.png 1,088 × 783; 68 KB
-
 2013-05-19 24-hr Precipitation Map NOAA.png 1,000 × 710; 27 KB
-
 2013-05-19 500-Millibar Height Contour Map NOAA.png 1,040 × 780; 47 KB
-
 2013-05-19 Color Max-min Temperature Map NOAA.png 800 × 350; 12 KB
-
 2013-05-19 Max-min Temperature Map NOAA.png 1,000 × 710; 28 KB
-
 2013-05-19 Surface Weather Map NOAA.png 1,088 × 783; 69 KB
-
 2013-05-20 24-hr Precipitation Map NOAA.png 1,000 × 710; 28 KB


