File:Zahl der Erstanträge auf Asyl (Eurostat).svg
Jump to navigation
Jump to search

Size of this PNG preview of this SVG file: 800 × 400 pixels. Other resolutions: 320 × 160 pixels | 640 × 320 pixels | 1,024 × 512 pixels | 1,280 × 640 pixels | 2,560 × 1,280 pixels.
Original file (SVG file, nominally 800 × 400 pixels, file size: 30 KB)
Captions
Captions
Add a one-line explanation of what this file represents
Summary[edit]
.svg&action=edit§ion=1)
| Description |
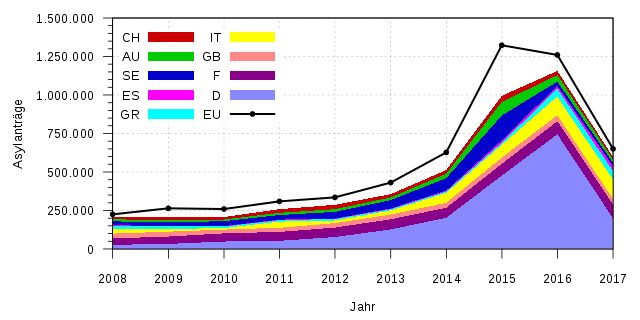
Deutsch: Anzahl der Asylanträge in der EU insgesamt (Schwarzweißer Graph) und von 9 europäschen Ländern (nicht alle Mitgl. EU). Zuordnung zu den farbigen Flächen von unten nach oben: D F GB IT GR ES SE AU CH |
| Source | Own work - Zahlen: Eurostat [1] & Übersicht [2] |
| Author | Summer ... hier! (talk) 17:36, 4 November 2017 (UTC) |
![[1]](https://ec.europa.eu/eurostat/statistics-explained/index.php?title=File:First_time_asylum_applicants,_Q4_2016_%E2%80%93_Q4_2017.png)
Licensing[edit]
.svg&action=edit§ion=2)

|
The copyright holder of this file, Eurostat, allows anyone to use it for any purpose, provided that the copyright holder is properly attributed. Redistribution, derivative work, commercial use, and all other use is permitted. |
Attribution:
Eurostat (year)
|
This media file was created by Eurostat, the European Statistical Office and a Directorate-Generale of the EU Commission.
Under Eurostat's Copyright Notice and Free Re-Use of Data, they encourage free re-use of its data, both for non-commercial and commercial purposes. All statistical data, metadata, content of web pages or other dissemination tools, official publications and other documents published on its website, with the exceptions listed below, can be reused without any payment or written licence provided that:
|
 |
}}}
I, the copyright holder of this work, hereby publish it under the following license:
| This file is made available under the Creative Commons CC0 1.0 Universal Public Domain Dedication. | |
| The person who associated a work with this deed has dedicated the work to the public domain by waiving all of their rights to the work worldwide under copyright law, including all related and neighboring rights, to the extent allowed by law. You can copy, modify, distribute and perform the work, even for commercial purposes, all without asking permission.
|
Gnuplot script to generate this plot[edit]
.svg&action=edit§ion=3)
W3C-validity not checked.
#!/usr/bin/gnuplot
# gnuplot


# Daten per Here-Document
# (zur tech. Beschreibung siehe Abschntt 'Inline data and datablocks'
# in http://www.gnuplot.info/docs_5.2/Gnuplot_5.2.pdf )
#
$my_HereDoc << EndOfData
# Quelle:
# https://de.wikipedia.org/wiki/Fl%C3%BCchtlingskrise_in_Europa_ab_2015#Zahlen_und_Fakten
# bzw.
# https://de.wikipedia.org/w/index.php?title=Fl%C3%BCchtlingskrise_in_Europa_ab_2015&oldid=179136851
#
#    Datum      EU        D      F     GB      IT     GR     ES      SE     AU     CH
#
01.01.2008;  225150;  26845; 41840; 31290;  30140; 19885;  4515;  24785; 12715; 16520
01.01.2009;  263835;  32910; 47620; 31665;  17640; 15925;  3005;  24175; 15780; 15900
01.01.2010;  259400;  48475; 52725; 24335;  10000; 10275;  2740;  31850; 11045; 15425
01.01.2011;  309040;  53235; 57330; 26915;  40315;  9310;  3420;  29650; 14420; 23615
01.01.2012;  335290;  77485; 61440; 28800;  17335;  9575;  2565;  43855; 17415; 28400
01.01.2013;  431090; 126705; 66265; 30585;  26620;  8225;  4485;  54270; 17500; 21305
01.01.2014;  626960; 202645; 64310; 32785;  64625;  9430;  5615;  81180; 28035; 23555
01.01.2015; 1322825; 476510; 76165; 40160;  83540; 13205; 14780; 162450; 88160; 39445
01.01.2016; 1259955; 745155; 84270; 38785; 122960; 51110; 15755;  28790; 42255; 27140
01.01.2017;  649855; 198255; 91070; 33310; 126550; 57020; 30455;  22190; 22160; 16615
#
EndOfData


# Allgemeines zu den Eingabedaten
set timefmt "%d.%m.%Y"     # Zeitangaben in TT.MM.YYYY
set datafile separator ";" # Spaltenseparator


# Allgemeines zur Ausgabe
unset key
set key vertical maxrows 6
set key left top           # Legende link oben
set style data lines
set style fill transparent solid 1.0 noborder
set grid


# Bereiche/Format/etc X-Achse
set xdata time
set xlabel 'Jahr'
set xrange ['01.01.2008':'01.01.2017']
set xtics '01.01.1000', 60 * 60 * 24 * 365.25 * 1
                      #  xtics in Sekunden
                      # der Beginn der X-Einteilung kann außerhalb xrange
                      # liegen
set mxtics 1          # Unterteilung der Skalierung
set xtics nomirror    # Nur unten Skalieren
set format x '%Y'     # Beschriftungsformat JJJJ
set xtics  out        # Skal. aussen da sie sonst von Grafik überschr. wird


# Bereiche/Format/etc Y-Achse
set ylabel 'Asylanträge'
set ylabel offset 2.5, 0.0 # Beschriftung näher an die Y-Achse
set yrange [0:]
set ytics 250000
set mytics 5
set ytics nomirror
set decimalsign locale "de_DE.utf8"
set format y  "%'.0f" # Ausgabeformat
set ytics  out        # Skal. aussen da sie sonst von Grafik überschr. wird


# Ausgabeformat: Wir erzeugen SVG
# Die Ausgabedaten leiten wir in eine Pipe und sind so bei Namen der
# Ausgabedatei flexibel (Aufruf: Progname.plt > Ausgabe-svg)
set term svg size 800,400 font "Arial,16"
# keine "set output '<Dateiname>'" Angabe


# Abkürzungen:
# rgb       : red-green-blue
# fs        : fillstyle
# filledc   : filledcurves
# lc        : linecolor
# lp        : linespoints
# lt        : linetype
# w         : with
# lw        : linewidth
# pt        : pointtype
# ps        : pointsize
# usi       : using
# ti        : title

# Erzeugen der Ausgabe (zum Anlegen der Datei 'daten.scv' siehe unten)
plot \
  $my_HereDoc usi 1:($3+$4+$5+$6+$7+$8+$9+$10+$11) ti 'CH' w filledc below x1 lt rgb '#CC0000', \
  $my_HereDoc usi 1:($3+$4+$5+$6+$7+$8+$9+$10    ) ti 'AU' w filledc below x1 lt rgb '#00CC00', \
  $my_HereDoc usi 1:($3+$4+$5+$6+$7+$8+$9        ) ti 'SE' w filledc below x1 lt rgb '#0000CC', \
  $my_HereDoc usi 1:($3+$4+$5+$6+$7+$8           ) ti 'ES' w filledc below x1 lt rgb '#FF00FF', \
  $my_HereDoc usi 1:($3+$4+$5+$6+$7              ) ti 'GR' w filledc below x1 lt rgb '#00FFFF', \
  $my_HereDoc usi 1:($3+$4+$5+$6                 ) ti 'IT' w filledc below x1 lt rgb '#FFFF00', \
  $my_HereDoc usi 1:($3+$4+$5                    ) ti 'GB' w filledc below x1 lt rgb '#FF8888', \
  $my_HereDoc usi 1:($3+$4                       ) ti  'F' w filledc below x1 lt rgb '#880088', \
  $my_HereDoc usi 1:($3                          ) ti  'D' w filledc below x1 lt rgb '#8888FF', \
  $my_HereDoc usi 1:($2) ti 'EU' w lp lc '#000000' lt 1 lw 2.5 pt 7 ps 0.6


quit
File history
Click on a date/time to view the file as it appeared at that time.
| Date/Time | Thumbnail | Dimensions | User | Comment | |
|---|---|---|---|---|---|
| current | 19:05, 23 June 2018 | | 800 × 400 (30 KB) | Summer ... hier! (talk | contribs) | yLabel näher an yAchse |
| 19:55, 23 April 2018 |  | 800 × 400 (30 KB) | Summer ... hier! (talk | contribs) | +Daten 2017 | |
| 01:03, 4 January 2018 |  | 800 × 400 (36 KB) | Summer ... hier! (talk | contribs) | Schriftfont 16 statt 14 | |
| 00:22, 6 November 2017 |  | 800 × 400 (36 KB) | Summer ... hier! (talk | contribs) | Legende | |
| 17:36, 4 November 2017 |  | 800 × 400 (33 KB) | Summer ... hier! (talk | contribs) | {{Information |Description = {{de|Anzahl der Asylanträge in der EU insgesamt (Schwarzweißer Graph und nach 11 Ländern) }} |Source = {{own}} |Author = ~~~~ |Date = }} == {{int:license-header}} == {{self|Cc-zero}} == Gn... |
You cannot overwrite this file.
File usage on Commons
There are no pages that use this file.
File usage on other wikis
The following other wikis use this file:
- Usage on de.wikipedia.org
- Usage on uk.wikipedia.org
.svg&oldid=453249720)