File:Zabrze population.svg
Jump to navigation
Jump to search

Size of this PNG preview of this SVG file: 800 × 400 pixels. Other resolutions: 320 × 160 pixels | 640 × 320 pixels | 1,024 × 512 pixels | 1,280 × 640 pixels | 2,560 × 1,280 pixels.
Original file (SVG file, nominally 800 × 400 pixels, file size: 29 KB)
Captions
Captions
Add a one-line explanation of what this file represents
Summary
[edit]
| Description |
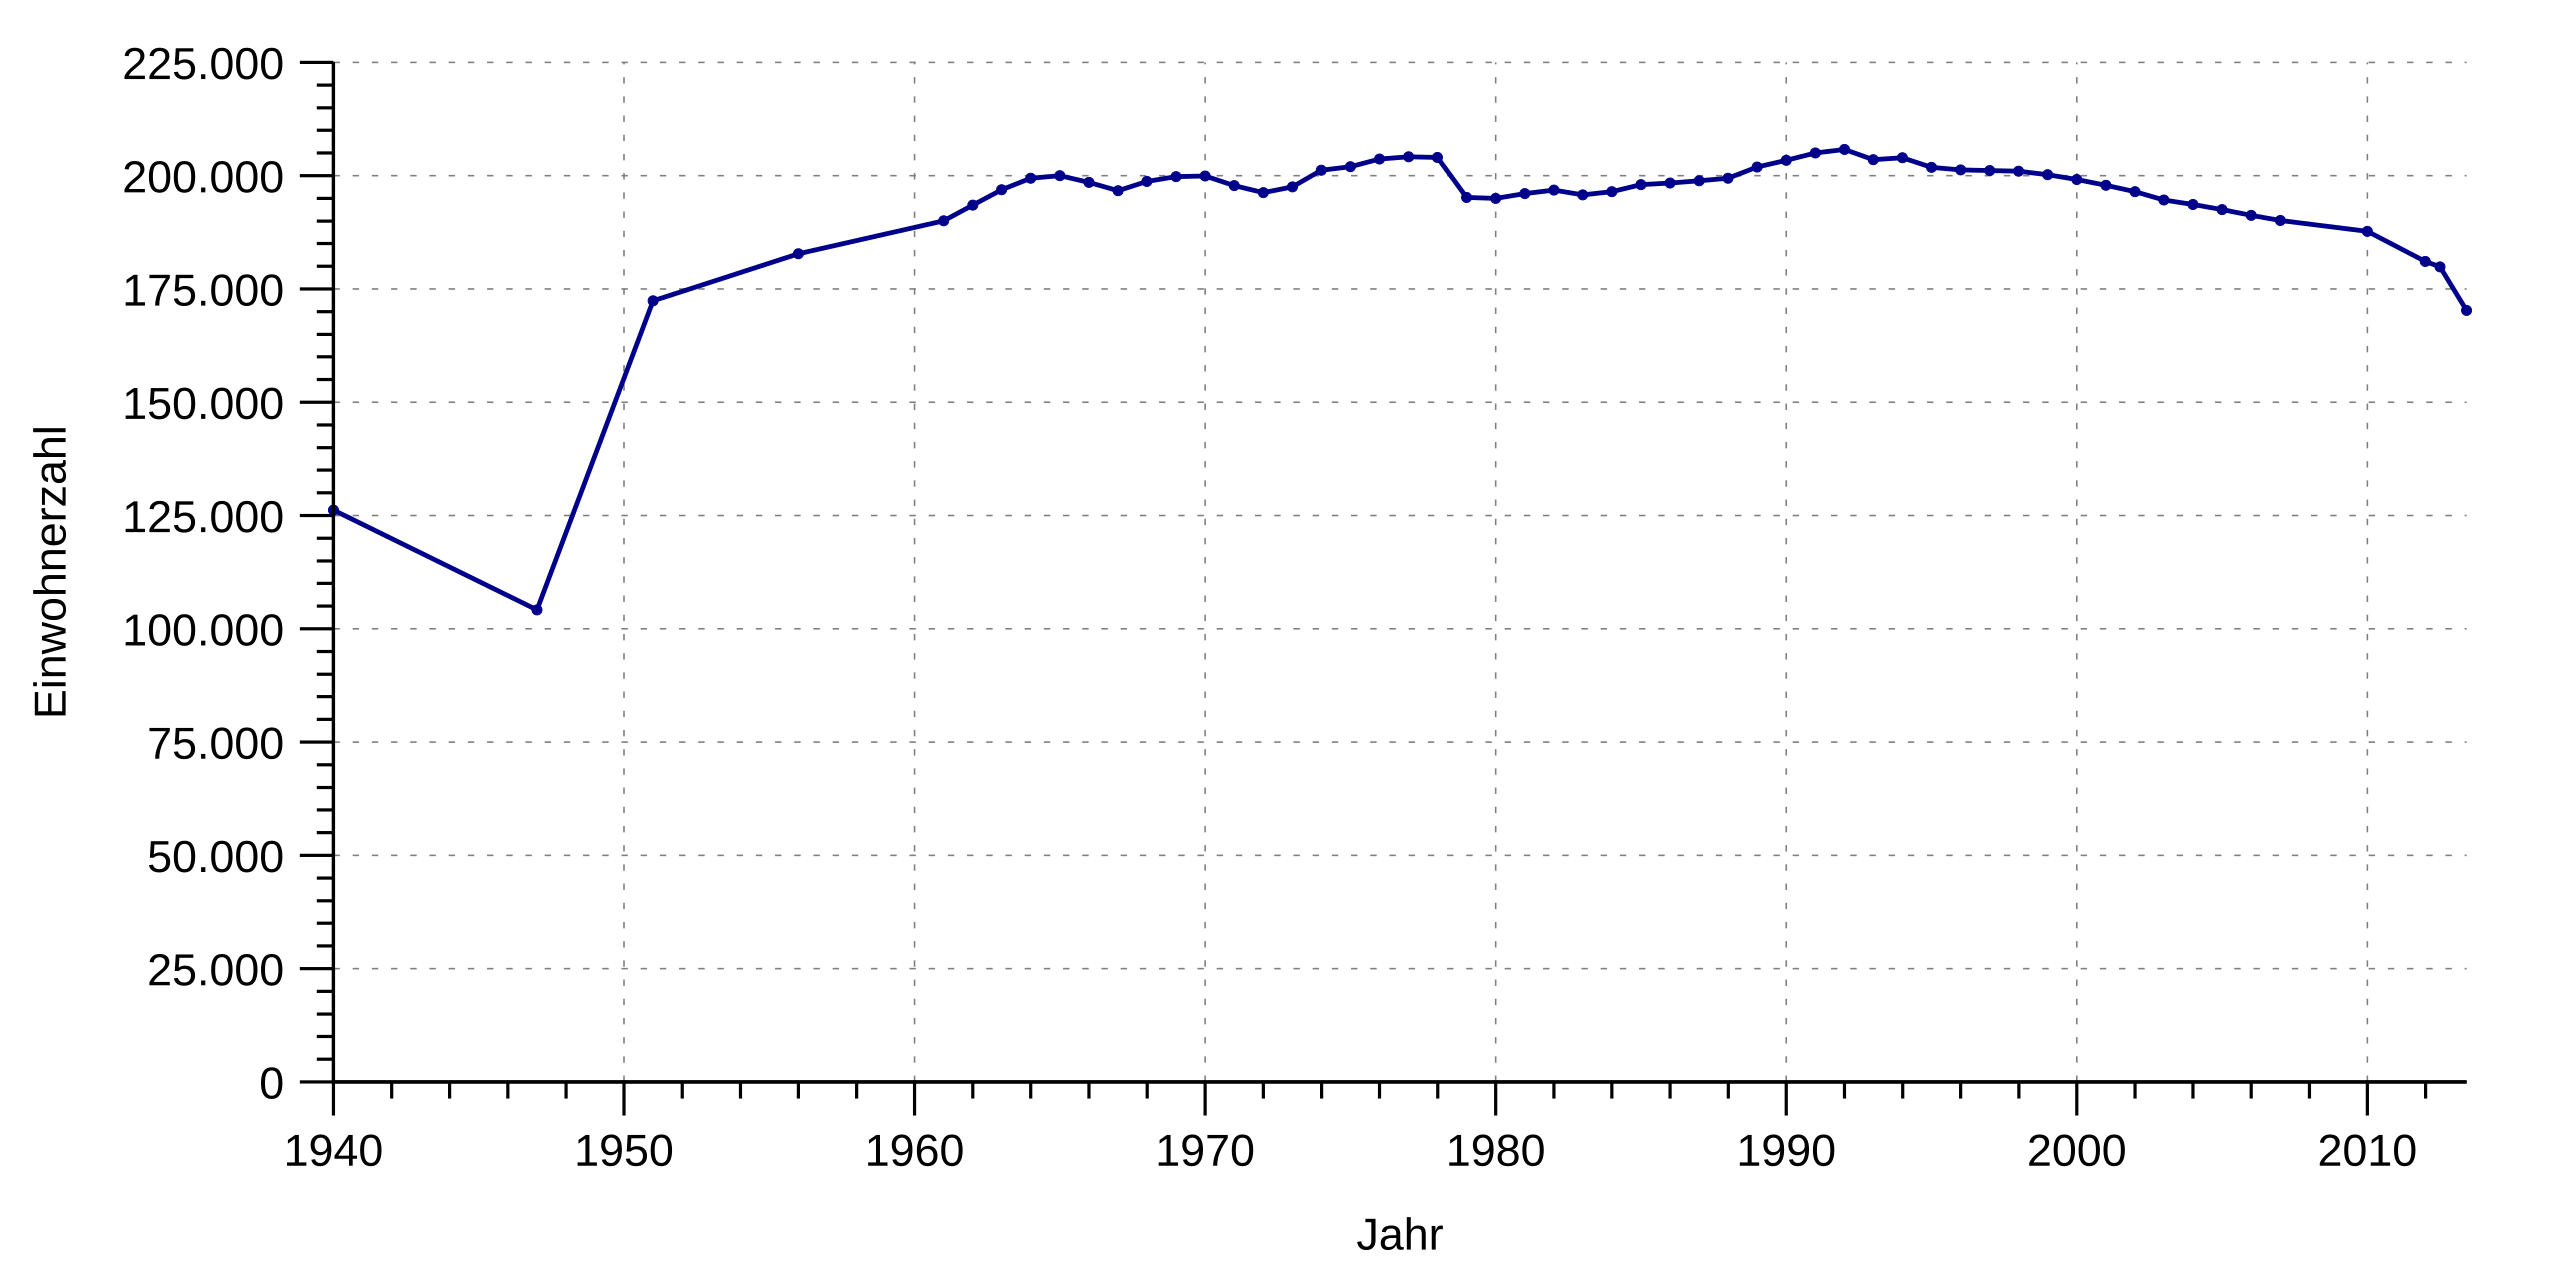
Deutsch: Einwohnerentwicklung |
| Date | 2 July 2016 (upload date) |
| Source |
This file was derived from: Berlin population.svg: |
| Author | Summer ... hier! |
| Permission (Reusing this file) |
I, the copyright holder of this work, hereby publish it under the following license: This file is licensed under the Creative Commons Attribution-Share Alike 3.0 Unported license.
|
| SVG development | This population chart was created with Gnuplot. This file uses translateable embedded text. |
| Source code | Gnuplot code#!/usr/bin/gnuplot
# gnuplot
# Allgemeines zu den Eingabedaten
set timefmt "%d.%m.%Y" # Zeitangaben in TT.MM.YYYY
set datafile separator ";" # Spaltenseparator
# Allgemeines zur Ausgabe
unset key
set style data lines
set style fill transparent solid 0.4
set grid
set border 3 # Bit 1 (unten) + Bit 2 (links)
# Bereiche/Format/etc X-Achse
set xdata time
set xlabel 'Jahr' # Beschr. X-Achse
set xlabel offset 0, 0.75 # Schrift etwas höher
set xrange ['31.12.1939':'31.05.2013']
set xtics '01.01.1000', 60 * 60 * 24 * 365.25 * 10
# xtics in Sekunden
# der Beginn der X-Einteilung kann außerhalb xrange
# liegen
set xtics offset 0, 0.5 # Beschritung näher an die X-Achse
set mxtics 5 # Skalenstriche
set xtics nomirror # Nur unten Skalieren
set format x '%Y' # Beschriftungsformat JJJJ
set xtics out # Skal. aussen damit sich nicht von Grafik
# überschr. wird
# Bereiche/Format/etc Y-Achse
set ylabel 'Einwohnerzahl' offset 2 # Abstand Achse/Label
set yrange [0:]
set ytics 25000
set ytics offset 0.5 # Schrift etwas nach rechts
set ytics nomirror
set decimalsign locale "de_DE.utf8"
set decimal locale "de_DE.utf8"
set format y "%'.0f" # Ausgabeformat
set mytics 5
set ytics out # Skal. aussen da sie sonst von Grafik
# überschr. wird
# Ausgabeformat: Wir erzeugen SVG
# Die Ausgabedaten leiten wir in eine Pipe und sind so bei Namen der
# Ausgabedatei flexibel (Aufruf: Progname.plt > Ausgabe-svg)
set term svg size 800,400 font "Arial,14"
# keine "set output '<Dateiname>'" Angabe
# Erzeugen der Ausgabe
plot \
'-' using 1:2 with linespoints linecolor 'dark-blue' linetype 1 linewidth 1.5 pointtype 7 pointsize 0.30
Data#
# Quelle:
# https://de.wikipedia.org/wiki/Einwohnerentwicklung_von_Zabrze
#
31.12.1939;126220
31.12.1946;104184
31.12.1950;172355
31.12.1955;182762
31.12.1960;190049
31.12.1961;193500
31.12.1962;196900
31.12.1963;199400
31.12.1964;200000
31.12.1965;198538
31.12.1966;196700
31.12.1967;198700
31.12.1968;199800
31.12.1969;199900
31.12.1970;197840
31.12.1971;196233
31.12.1972;197500
31.12.1973;201200
31.12.1974;202009
31.12.1975;203683
31.12.1976;204200
31.12.1977;204000
31.12.1978;195200
31.12.1979;195000
31.12.1980;196028
31.12.1981;196841
31.12.1982;195768
31.12.1983;196445
31.12.1984;197989
31.12.1985;198404
31.12.1986;198868
31.12.1987;199441
31.12.1988;201900
31.12.1989;203367
31.12.1990;205029
31.12.1991;205789
31.12.1992;203524
31.12.1993;203950
31.12.1994;201838
31.12.1995;201302
31.12.1996;201122
31.12.1997;200976
31.12.1998;200177
31.12.1999;199153
31.12.2000;197910
31.12.2001;196465
31.12.2002;194638
31.12.2003;193665
31.12.2004;192546
31.12.2005;191247
31.12.2006;190110
31.12.2009;187700
31.12.2011;181100
30.06.2012;179861
31.05.2013;170263
EOF # Ende
|
File history
Click on a date/time to view the file as it appeared at that time.
| Date/Time | Thumbnail | Dimensions | User | Comment | |
|---|---|---|---|---|---|
| current | 22:16, 16 November 2017 | | 800 × 400 (29 KB) | Summer ... hier! (talk | contribs) | + Daten für 2011; Stil geändert |
| 23:43, 2 July 2016 |  | 800 × 400 (17 KB) | Summer ... hier! (talk | contribs) | =={{int:filedesc}}== {{Information |description={{de|Einwohnerentwicklung}} |source={{Derived from|Berlin population.svg|display=50}} |author={{U|Summer ... hier!}} |date= {{Uploaddate|2016-07-02}} }} =={{int:license-header}}== {{self|cc-by-sa-3.0}}... |
You cannot overwrite this file.
File usage on Commons
The following page uses this file:
File usage on other wikis
The following other wikis use this file:
- Usage on de.wikipedia.org