File:Wiggers Diagram IT.png
Jump to navigation
Jump to search

Size of this preview: 800 × 550 pixels. Other resolutions: 320 × 220 pixels | 640 × 440 pixels | 841 × 578 pixels.
Original file (841 × 578 pixels, file size: 98 KB, MIME type: image/png)
Captions
Captions
Add a one-line explanation of what this file represents
Summary[edit]
| Description |
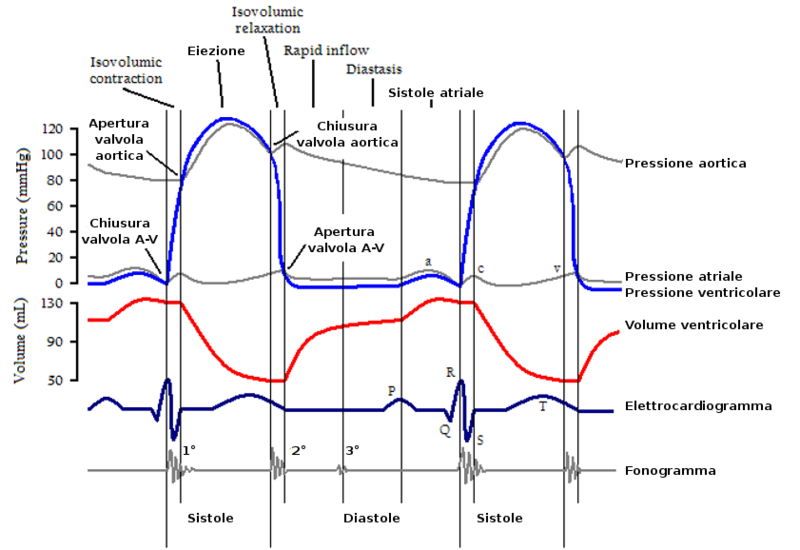
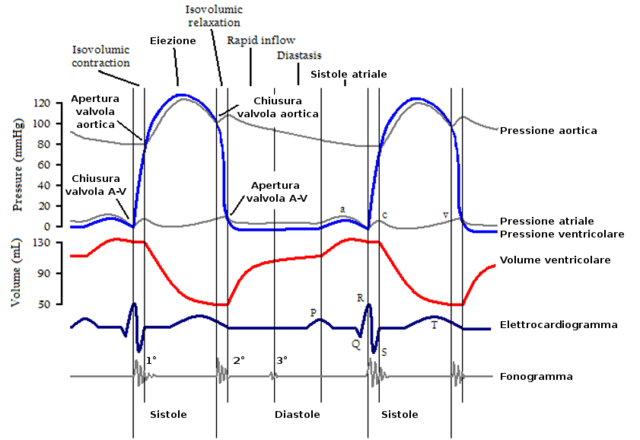
English: A Wiggers diagram, showing the cardiac cycle events occuring in the left ventricle. In the atrial pressure plot: wave "a" corresponds to atrial contraction, wave "c" corresponds to an increase in pressure from the mitral valve bulging into the atrium after closure, and wave "v" corresponds to passive atrial filling. In the electrocardiogram: wave "P" corresponds to atrial depolarization, waves "QRS" correspond to ventricular depolarization, and wave "T" corresponds to ventricular repolarization. In the phonocardiogram: The sound labeled 1st contributes to the S1 heart sound and is the reverberation of blood from the sudden closure of the mitral valve (left A-V valve) and the sound labeled "2nd" contributes to the S2 heart sound and is the reverberation of blood from the sudden closure of the aortic valve. |
| Date | |
| Source |
This file was derived from: Wiggers Diagram.svg: |
| Author |
|
| Other versions |
[] SVG[edit]
PNG[edit]
|


| This is a retouched picture, which means that it has been digitally altered from its original version. Modifications: Traduzione in italiano. The original can be viewed here: Wiggers Diagram.svg:
|
Licensing[edit]
I, the copyright holder of this work, hereby publish it under the following license:
This file is licensed under the Creative Commons Attribution-Share Alike 2.5 Generic license.
- You are free:
- to share – to copy, distribute and transmit the work
- to remix – to adapt the work
- Under the following conditions:
- attribution – You must give appropriate credit, provide a link to the license, and indicate if changes were made. You may do so in any reasonable manner, but not in any way that suggests the licensor endorses you or your use.
- share alike – If you remix, transform, or build upon the material, you must distribute your contributions under the same or compatible license as the original.
Original upload log[edit]
This image is a derivative work of the following images:
- File:Wiggers_Diagram.svg licensed with Cc-by-sa-2.5
- 2012-03-21T17:56:52Z Xavax 1098x841 (21732 Bytes) Code reduced
- 2012-03-20T19:38:55Z Xavax 1053x841 (31177 Bytes) some corrections: text, colors and positons of text objects
- 2012-03-20T12:56:05Z Xavax 1053x841 (30187 Bytes) now 200%
- 2012-03-20T11:27:17Z Xavax 528x421 (30748 Bytes) =={{int:filedesc}}== {{Information |description={{en|1=A Wiggers diagram, showing the cardiac cycle events occuring in the left ventricle. In the atrial pressure plot: wave "a" corresponds to atrial contraction, wave "c" co
- 2012-03-20T11:19:31Z Xavax 528x421 (32407 Bytes) =={{int:filedesc}}== {{Information |description={{en|1=A Wiggers diagram, showing the cardiac cycle events occuring in the left ventricle. In the atrial pressure plot: wave "a" corresponds to atrial contraction, wave "c" co
- 2012-03-20T11:16:24Z Xavax 528x421 (31843 Bytes) =={{int:filedesc}}== {{Information |description={{en|1=A Wiggers diagram, showing the cardiac cycle events occuring in the left ventricle. In the atrial pressure plot: wave "a" corresponds to atrial contraction, wave "c" co
- 2012-03-20T11:12:15Z Xavax 528x421 (31391 Bytes) =={{int:filedesc}}== {{Information |description={{en|1=A Wiggers diagram, showing the cardiac cycle events occuring in the left ventricle. In the atrial pressure plot: wave "a" corresponds to atrial contraction, wave "c" co
- 2012-03-20T11:10:17Z Xavax 528x421 (29263 Bytes) =={{int:filedesc}}== {{Information |description={{en|1=A Wiggers diagram, showing the cardiac cycle events occuring in the left ventricle. In the atrial pressure plot: wave "a" corresponds to atrial contraction, wave "c" co
- 2012-03-20T11:08:20Z Xavax 528x421 (28672 Bytes) =={{int:filedesc}}== {{Information |description={{en|1=A Wiggers diagram, showing the cardiac cycle events occuring in the left ventricle. In the atrial pressure plot: wave "a" corresponds to atrial contraction, wave "c" co
- 2012-03-20T11:00:13Z Xavax 528x421 (26137 Bytes) =={{int:filedesc}}== {{Information |description={{en|1=A Wiggers diagram, showing the cardiac cycle events occuring in the left ventricle. In the atrial pressure plot: wave "a" corresponds to atrial contraction, wave "c" co
- 2012-03-20T10:44:03Z Xavax 528x421 (26204 Bytes) =={{int:filedesc}}== {{Information |description={{en|1=A Wiggers diagram, showing the cardiac cycle events occuring in the left ventricle. In the atrial pressure plot: wave "a" corresponds to atrial contraction, wave "c" co
Uploaded with derivativeFX
File history
Click on a date/time to view the file as it appeared at that time.
| Date/Time | Thumbnail | Dimensions | User | Comment | |
|---|---|---|---|---|---|
| current | 09:29, 9 October 2012 | | 841 × 578 (98 KB) | Adert (talk | contribs) | == {{int:filedesc}} == {{Information |Description={{en|1=A Wiggers diagram, showing the cardiac cycle events occuring in the left ventricle. In the atrial pressure plot: wave "a" corresponds to atrial contraction, wave "c" corresponds to an increase ... |
You cannot overwrite this file.
File usage on Commons
The following 8 pages use this file: