File:Wahlergebnisse aut FullHurde.svg
Jump to navigation
Jump to search

Size of this PNG preview of this SVG file: 800 × 400 pixels. Other resolutions: 320 × 160 pixels | 640 × 320 pixels | 1,024 × 512 pixels | 1,280 × 640 pixels | 2,560 × 1,280 pixels.
Original file (SVG file, nominally 800 × 400 pixels, file size: 57 KB)
Captions
Captions
Add a one-line explanation of what this file represents
Summary[edit]
| Description |
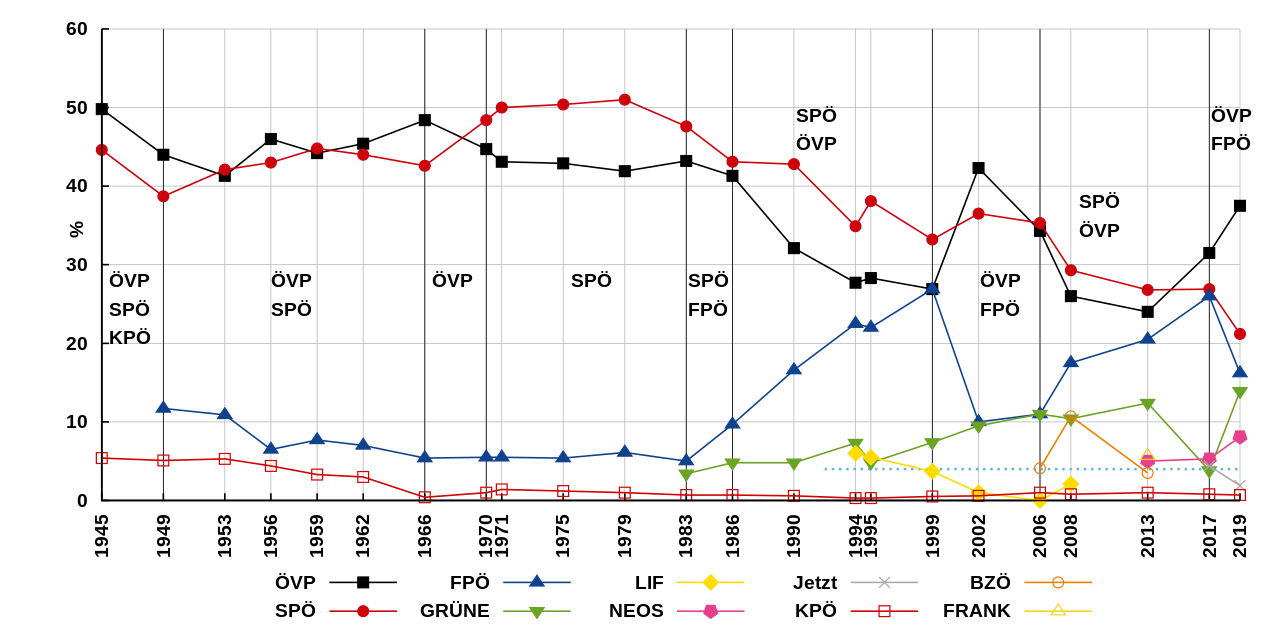
Deutsch: Wahlergebnisse Östereich Nationalratswahl 2017 |
| Date | |
| Source | Own work based on: Wahlergebnisse aut2017Full.svg |
| Author | Johannes Kalliauer |
| SVG development | This plot uses embedded text that can be easily translated using a text editor. |
| Source code | Gnuplot codereset
set term svg size 800,400 fname 'Liberation Sans bold'
set key below center
set border 3
set tics nomirror scale .5
set xtics rotate by 90 right
set grid back lt 1 lw .5 lc rgb 0xbbbbbb
set for[ii=2:11] style line ii pt (2*ii+1) ps .75
set style line 2 lc rgb 0x000000
set style line 3 lc rgb 0xCE000C
set style line 4 lc rgb 0x0E428E
set style line 5 lc rgb 0x6BA325
set style line 6 lc rgb 0xffdc00
set style line 7 lc rgb 0xE6408D
set style line 8 lc rgb 0xaaaaaa
set style line 9 lc rgb 0xD40000
set style line 10 lc rgb 0xEE7F00
set style line 11 lc rgb 0xf8d323
set style line 12 lc rgb 0xbbbbbb
set ylabel '%' offset graph .05,.075
yh = 28
set label "ÖVP\nSPÖ\nKPÖ" at 1945.5,yh
set label "ÖVP\nSPÖ" at 1956.0,yh
set label "ÖVP" at 1966.5,yh
set label "SPÖ" at 1975.5,yh
set label "SPÖ\nFPÖ" at 1983.1,yh
set label "SPÖ\nÖVP" at 1990.1,49
set label "ÖVP\nFPÖ" at 2002.1,yh
set label "SPÖ\nÖVP" at 2008.5,38
set label "ÖVP\nFPÖ" at 2017.1,49
set arrow nohead from 1949,0 to 1949,graph 1 lw .5
set arrow nohead from 1966,0 to 1966,graph 1 lw .5
set arrow nohead from 1970,0 to 1970,graph 1 lw .5
set arrow nohead from 1983,0 to 1983,graph 1 lw .5
set arrow nohead from 1986,0 to 1986,graph 1 lw .5
set arrow nohead from 1999,0 to 1999,graph 1 lw .5
set arrow nohead from 2006,0 to 2006,graph 1 lw .5
set arrow nohead from 2017,0 to 2017,graph 1 lw .5
set output 'wahl_aut.svg'
set arrow 11 from 1992,4 to 2019,4 nohead lw 1.5 lt 3 dt 3
plot for[ii=2:11] 'wahl_autGW.txt' u 1:ii:xticlabel(1) t columnhead(ii) w lp ls ii
unset output
DataJahr ÖVP SPÖ FPÖ GRÜNE LIF NEOS Jetzt KPÖ BZÖ FRANK
1945 49.8 44.6 - - - - - 5.4 - -
1949 44.0 38.7 11.7 - - - - 5.1 - -
1953 41.3 42.1 10.9 - - - - 5.3 - -
1956 46.0 43.0 6.5 - - - - 4.4 - -
1959 44.2 44.8 7.7 - - - - 3.3 - -
1962 45.4 44.0 7.0 - - - - 3.0 - -
1966 48.4 42.6 5.4 - - - - 0.4 - -
1970 44.7 48.4 5.5 - - - - 1.0 - -
1971 43.1 50.0 5.5 - - - - 1.4 - -
1975 42.9 50.4 5.4 - - - - 1.2 - -
1979 41.9 51.0 6.1 - - - - 1.0 - -
1983 43.2 47.6 5.0 3.4 - - - 0.7 - -
1986 41.3 43.1 9.7 4.8 - - - 0.7 - -
1990 32.1 42.8 16.6 4.8 - - - 0.6 - -
1994 27.7 34.9 22.5 7.3 6.0 - - 0.3 - -
1995 28.3 38.1 22.0 4.8 5.5 - - 0.3 - -
1999 26.9 33.2 26.9 7.4 3.7 - - 0.5 - -
2002 42.3 36.5 10.0 9.5 1.0 - - 0.6 - -
2006 34.3 35.3 11.0 11.0 0.0 - - 1.0 4.1 -
2008 26.0 29.3 17.5 10.4 2.1 - - 0.8 10.7 -
2013 24.0 26.8 20.5 12.4 - 5.0 - 1.0 3.5 5.7
2017 31.5 26.9 26.0 3.8 - 5.3 4.4 0.8 - -
2019 37.5 21.2 16.2 13.9 - 8.1 1.9 0.7 - -
|
Licensing[edit]
Johannes Kalliauer, the copyright holder of this work, hereby publishes it under the following license:
This file is licensed under the Creative Commons Attribution 4.0 International license.
Attribution: Johannes Kalliauer
- You are free:
- to share – to copy, distribute and transmit the work
- to remix – to adapt the work
- Under the following conditions:
- attribution – You must give appropriate credit, provide a link to the license, and indicate if changes were made. You may do so in any reasonable manner, but not in any way that suggests the licensor endorses you or your use.
File history
Click on a date/time to view the file as it appeared at that time.
| Date/Time | Thumbnail | Dimensions | User | Comment | |
|---|---|---|---|---|---|
| current | 17:28, 5 October 2019 | | 800 × 400 (57 KB) | JoKalliauer (talk | contribs) | de:w:Benutzer_Diskussion:JoKalliauer#Wahldiagramme |
| 17:34, 29 September 2019 |  | 800 × 400 (57 KB) | JoKalliauer (talk | contribs) | zwischenstand der Wahlprognose | |
| 15:19, 21 October 2017 |  | 512 × 256 (24 KB) | JoKalliauer (talk | contribs) | spo und ovp verkehrt | |
| 15:04, 21 October 2017 |  | 512 × 256 (24 KB) | JoKalliauer (talk | contribs) | huerde wurde 1992 eingeführt | |
| 11:04, 21 October 2017 |  | 512 × 256 (24 KB) | JoKalliauer (talk | contribs) |
You cannot overwrite this file.
File usage on Commons
The following 5 pages use this file:
File usage on other wikis
The following other wikis use this file:
- Usage on de.wikipedia.org
- Usage on nl.wikipedia.org