File:Ueberdosis-durch-opioide-usa.svg
Jump to navigation
Jump to search

Size of this PNG preview of this SVG file: 600 × 480 pixels. Other resolutions: 300 × 240 pixels | 960 × 768 pixels | 1,280 × 1,024 pixels | 2,560 × 2,048 pixels.
Original file (SVG file, nominally 600 × 480 pixels, file size: 27 KB)
Captions
Captions
Add a one-line explanation of what this file represents
Summary[edit]
| Description |
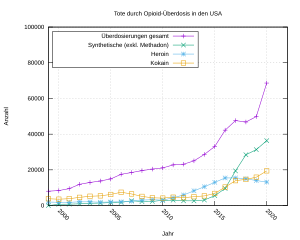
Deutsch: Tote durch Überdosis pro Jahr in den USA, im Zeitraum von 1999 bis 2020 Vergleich mehrerer Opioide |
| Source | Own work data from https://nida.nih.gov/research-topics/trends-statistics/overdose-death-rates |
| Author | A1000 |
| SVG development | This plot was created with Gnuplot. This plot uses embedded text that can be easily translated using a text editor. |
Licensing[edit]
I, the copyright holder of this work, hereby publish it under the following license:
| This file is made available under the Creative Commons CC0 1.0 Universal Public Domain Dedication. | |
| The person who associated a work with this deed has dedicated the work to the public domain by waiving all of their rights to the work worldwide under copyright law, including all related and neighboring rights, to the extent allowed by law. You can copy, modify, distribute and perform the work, even for commercial purposes, all without asking permission.
|
Gnuplot script to generate this plot[edit]
Source code
Gnuplot code
#!/usr/bin/gnuplot
set terminal svg
set output "ueberdosis-durch-opioide-usa.svg"
set grid
set title "Tote durch Opioid-Überdosis in den USA"
set xtics nomirror rotate by -45
set style fill solid border -1
set style data linespoints
set xlabel "Jahr"
set ylabel "Anzahl"
set key left box
plot [1999:2022] [0:100000] \
'ueberdosis-durch-opioide-usa.csv' using 1:3 title "Überdosen Total", \
'' using  1:4 title "Syntetische (excl. Methadon)"  , \
'' using 1:5 title "Heroin" , \
'' using 1:6 title "Kokain"
Data
#Jahr
#Total Overdose
#Any Opioid1
#Synthetic Opioids other than Methadone (primarily fentanyl)
#Heroin4
#Cocaine5

 1999	 16849	 8050	 3	 1960	 3822
 2000	 17415	 8407	 730	 1842	 3544
 2001	 19394	 9496	 782	 1779	 3833
 2002	 23518	 11920	 957	 2089	 4599
 2003	 25785	 12940	 1295	 2080	 5199
 2004	 27424	 13756	 1400	 1878	 5443
 2005	 29813	 14918	 1664	 2009	 6208
 2006	 34425	 17545	 1742	 2088	 7448
 2007	 36010	 18516	 2707	 2399	 6512
 2008	 36450	 19582	 2213	 3041	 5129
 2009	 37004	 20422	 2306	 3278	 4350
 2010	 38329	 21089	 2946	 3036	 4183
 2011	 41340	 22784	 3007	 4397	 4681
 2012	 41502	 23166	 2666	 5925	 4404
 2013	 43982	 25052	 2628	 8257	 4944
 2014	 47055	 28647	 3105	 10574	 5415
 2015	 52404	 33091	 5544	 12989	 6784
 2016	 63632	 42249	 9580	 15469	 10375
 2017	 70237	 47600	 19413	 15482	 13942
 2018	 67367	 46802	 28466	 14996	 14666
 2019	 70630	 49860	 31335	 14019	 15883
 2020	 91799	 68630	 36359	 13165	 19447
File history
Click on a date/time to view the file as it appeared at that time.
| Date/Time | Thumbnail | Dimensions | User | Comment | |
|---|---|---|---|---|---|
| current | 10:32, 31 July 2022 | | 600 × 480 (27 KB) | A1000 (talk | contribs) | == {{int:filedesc}} == {{Information |Description={{de|Tote durch Überdosis pro Jahr in den USA, im Zeitraum von 1999 bis 2020 Vergleich mehrerer Opioide}} |Source={{own}} data from https://nida.nih.gov/research-topics/trends-statistics/overdose-death-rates |Author={{U|A1000}} |other fields={{Igen|G|+|%| }} }} == {{int:license-header}} == {{self|Cc-zero}} == Gnuplot script to generate this plot == {{Igen|G|/|c1= #!/usr/bin/gnuplot set terminal svg set output "ueberdosis-durch-opioide-usa.sv... |
You cannot overwrite this file.
File usage on Commons
There are no pages that use this file.
File usage on other wikis
The following other wikis use this file:
- Usage on de.wikipedia.org