File:US timeline. Prescription opioid pain reliever deaths.jpg
Jump to navigation
Jump to search

Size of this preview: 800 × 600 pixels. Other resolutions: 320 × 240 pixels | 640 × 480 pixels | 1,024 × 768 pixels | 1,200 × 900 pixels.
Original file (1,200 × 900 pixels, file size: 184 KB, MIME type: image/jpeg)
Captions
Captions
Add a one-line explanation of what this file represents

|
File:US timeline. Prescription opioid pain reliever deaths.svg is a vector version of this file. It should be used in place of this JPG file when not inferior.
File:US timeline. Prescription opioid pain reliever deaths.jpg → File:US timeline. Prescription opioid pain reliever deaths.svg
For more information, see Help:SVG. |
 |
Summary[edit]
| Description |
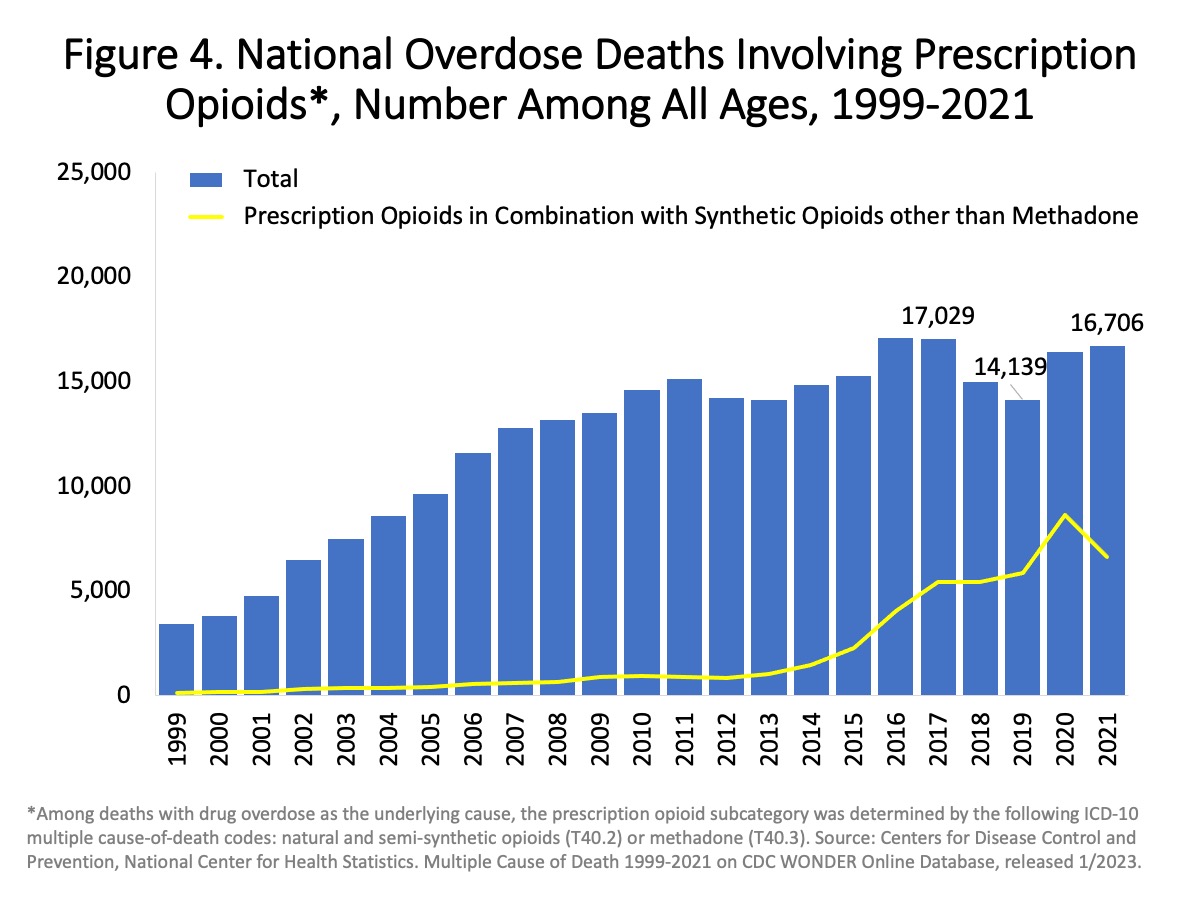
English: "Figure 4. National Overdose Deaths Involving Prescription Opioids, by other Opioid Involvement—Number Among All Ages, 1999-2021. The figure above is a bar and line graph showing the total number of U.S. overdose deaths involving prescription opioids (including natural and semi-synthetic opioids and methadone) from 1999 to 2021. Drug overdose deaths involving prescription opioids rose from 3,442 in 1999 to 17,029 in 2017. From 2017 to 2019, the number of deaths declined to 14,139. This was followed by a slight increase in 2020, with 16,416 reported deaths. In 2021, the number of reported deaths involving prescription opioids totaled 16,706. The bars are overlaid by a line showing the number of deaths involving prescription opioids in combination with synthetic opioids other than methadone (primarily fentanyl) from 1999 to 2021 (Source: CDC WONDER)." |
| Date | - date of first upload to the Commons. See file history for dates of later uploads. |
| Source | From Overdose Death Rates. By National Institute on Drug Abuse (NIDA). 1999-2021 chart. 1999-2019 chart. 2002-2016 chart. 2002-2015 chart. |
| Author | National Institute on Drug Abuse. Some charts were cropped to lessen outer white space. Some had "USA" added to it. Freeware IrfanView was used. The edited charts are under the same public domain license. See Commons:Convert tables and charts to wiki code or image files, and the section about adding text to chart images. |
Licensing[edit]
This image is a work of the National Institutes of Health, part of the United States Department of Health and Human Services, taken or made as part of an employee's official duties. As a work of the U.S. federal government, the image is in the public domain.
 |
||
| This file has been identified as being free of known restrictions under copyright law, including all related and neighboring rights. | ||
File history
Click on a date/time to view the file as it appeared at that time.
| Date/Time | Thumbnail | Dimensions | User | Comment | |
|---|---|---|---|---|---|
| current | 19:01, 12 July 2023 | | 1,200 × 900 (184 KB) | Timeshifter (talk | contribs) | Latest version |
| 13:18, 24 October 2021 |  | 1,150 × 868 (198 KB) | Timeshifter (talk | contribs) | Latest chart from source. | |
| 14:47, 6 September 2018 |  | 805 × 587 (103 KB) | Timeshifter (talk | contribs) | new version | |
| 13:24, 29 October 2017 |  | 857 × 662 (122 KB) | Timeshifter (talk | contribs) | Newer chart from same source. | |
| 07:15, 29 December 2015 |  | 835 × 592 (109 KB) | Timeshifter (talk | contribs) | User created page with UploadWizard |
You cannot overwrite this file.
File usage on Commons
The following 2 pages use this file:
File usage on other wikis
The following other wikis use this file:
- Usage on ar.wikipedia.org
- Usage on en.wikipedia.org
- Usage on hy.wikipedia.org
- Usage on it.wikipedia.org
- Usage on ja.wikipedia.org
- Usage on sr.wikipedia.org
- Usage on zh.wikipedia.org