File:Tracks of West-Central Pacific crossover storms.png
Jump to navigation
Jump to search

Size of this preview: 651 × 599 pixels. Other resolutions: 261 × 240 pixels | 522 × 480 pixels | 835 × 768 pixels | 1,113 × 1,024 pixels | 2,226 × 2,048 pixels | 4,000 × 3,681 pixels.
Original file (4,000 × 3,681 pixels, file size: 1.9 MB, MIME type: image/png)
Captions
Captions
Add a one-line explanation of what this file represents
Summary[edit]
| Description |
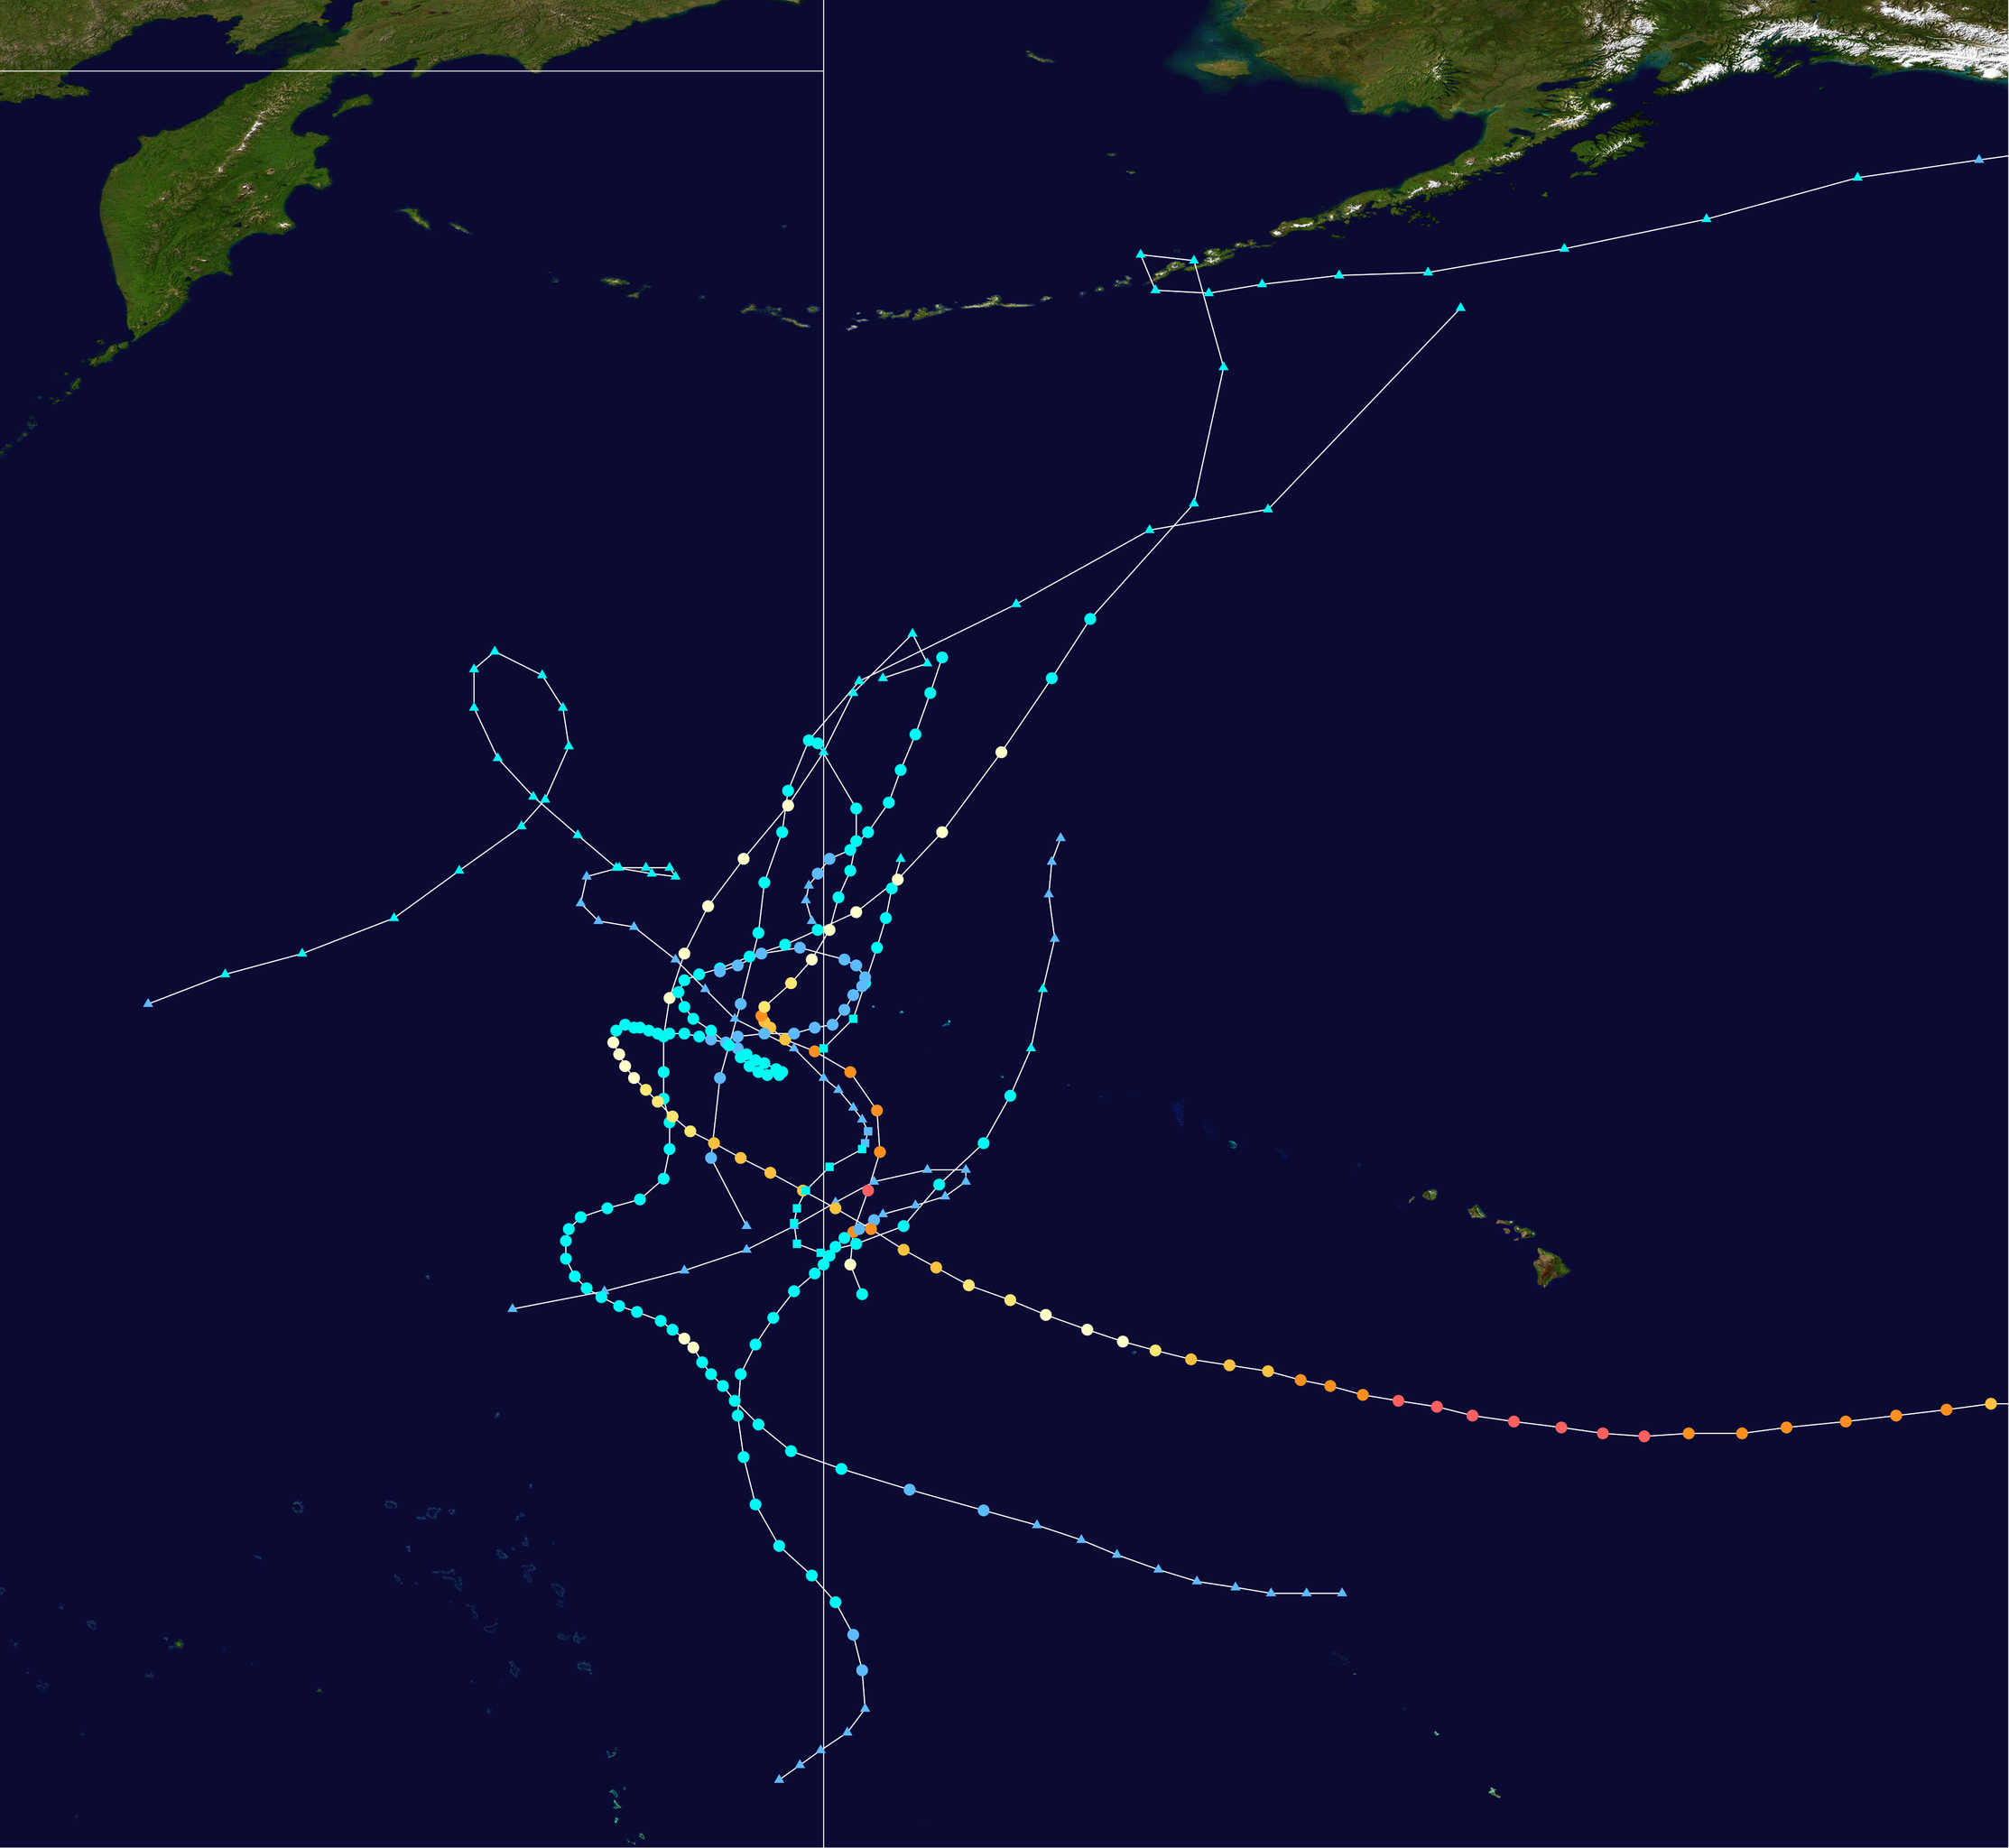
English: Track map of all hurricanes that crossed from the Western Pacific to the Central Pacific. The points show the location of the storm at 6-hour intervals. The colour represents the storm's maximum sustained wind speeds as classified in the Saffir-Simpson Hurricane Scale (see below), and the shape of the data points represent the nature of the storm, according to the legend below.
Tropical depression (≤38 mph, ≤62 km/h)
Tropical storm (39–73 mph, 63–118 km/h)
Category 1 (74–95 mph, 119–153 km/h)
Category 2 (96–110 mph, 154–177 km/h)
Category 3 (111–129 mph, 178–208 km/h)
Category 4 (130–156 mph, 209–251 km/h)
Category 5 (≥157 mph, ≥252 km/h)
Unknown
Storm type |
| Date | |
| Source | Created by Supportstorm using Wikipedia:WikiProject Tropical cyclones/Tracks. The background image is from NASA. Tracking data from the National Hurricane Center[1] or the Joint Typhoon Warning Center. [2] |
| Author | Supportstorm |
Licensing[edit]
| I, the copyright holder of this work, release this work into the public domain. This applies worldwide. In some countries this may not be legally possible; if so: I grant anyone the right to use this work for any purpose, without any conditions, unless such conditions are required by law. |
File history
Click on a date/time to view the file as it appeared at that time.
| Date/Time | Thumbnail | Dimensions | User | Comment | |
|---|---|---|---|---|---|
| current | 21:54, 5 July 2019 | | 4,000 × 3,681 (1.9 MB) | Supportstorm (talk | contribs) | + Moke |
| 19:01, 3 July 2019 |  | 3,600 × 4,046 (1.6 MB) | Supportstorm (talk | contribs) | Corrections | |
| 01:42, 3 July 2019 |  | 4,000 × 2,629 (343 KB) | Supportstorm (talk | contribs) | == {{int:filedesc}} == {{Information |Description={{en|Track map of all hurricanes that crossed from the Western Pacific to the Central Pacific. The points show the location of the storm at 6-hour intervals. The colour represents the storm's maximum sustained wind speeds as classified in the Saffir-Simpson Hurricane Scale (see below), and the shape of the data points represent the nature of... |
You cannot overwrite this file.
File usage on Commons
The following page uses this file:
File usage on other wikis
The following other wikis use this file:
- Usage on en.wikipedia.org