File:Thiel-Sen estimator.svg
Jump to navigation
Jump to search

Size of this PNG preview of this SVG file: 572 × 599 pixels. Other resolutions: 229 × 240 pixels | 458 × 480 pixels | 733 × 768 pixels | 978 × 1,024 pixels | 1,955 × 2,048 pixels | 2,936 × 3,075 pixels.
Original file (SVG file, nominally 2,936 × 3,075 pixels, file size: 37 KB)
Captions
Captions
Add a one-line explanation of what this file represents
Summary[edit]
| Description |
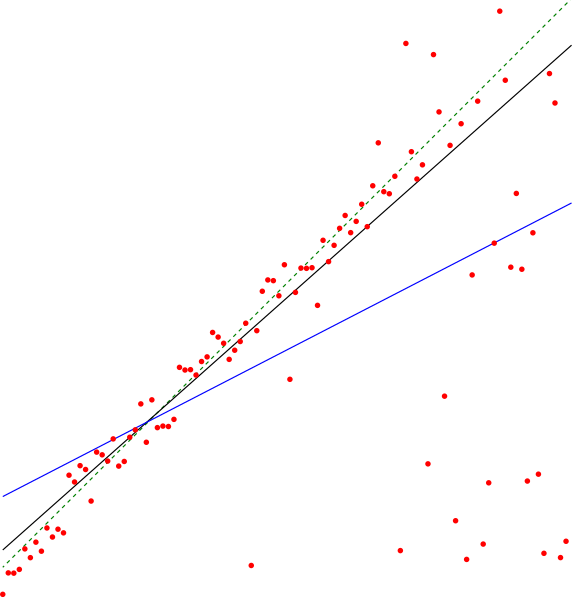
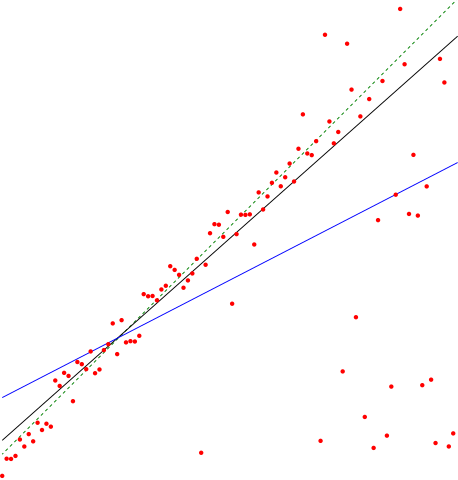
English: The en:Theil–Sen estimator (black line) of a set of sample points, compared to the simple linear regression line (blue). The points were generated by adding a small amount of jitter to points on the green dashed line and then replacing some of the points by random outliers. |
| Date | |
| Source | Own work |
| Author | David Eppstein |
Licensing[edit]
I, the copyright holder of this work, hereby publish it under the following license:
| This file is made available under the Creative Commons CC0 1.0 Universal Public Domain Dedication. | |
| The person who associated a work with this deed has dedicated the work to the public domain by waiving all of their rights to the work worldwide under copyright law, including all related and neighboring rights, to the extent allowed by law. You can copy, modify, distribute and perform the work, even for commercial purposes, all without asking permission.
|
Source code[edit]
This image was created as a pdf file by the following Python code, then converted to SVG.
from pyx import canvas,path,color
from random import random,seed
seed(12345)

N = 103
noise = 10
slope = 1.0

def sample(x):
    y = x * slope
    if random() < (y/N)**3:
        y = random()*N      # outlier
    else:
        y += (random()-0.5)*noise # non-outlier, jitter
    return y

samples = [(i*1.0,sample(i)) for i in range(N)]

c = canvas.canvas()

for x,y in samples:
    c.fill(path.circle(x,y,0.5),[color.rgb.red])

def theilsen(samples):
    N = len(samples)
    def slope(i,j):
        xi,yi = samples[i]
        xj,yj = samples[j]
        return (yi-yj)/(xi-xj)

    def median(L):
        L.sort()
        if len(L) & 1:
            return L[len(L)//2]
        else:
            return (L[len(L)//2 - 1] + L[len(L)//2])/2.0

    m = median([slope(i,j) for i in range(N) for j in range(i)])

    def error(i):
        x,y = samples[i]
        return y - m*x

    b = median([error(i) for i in range(N)])

    return m,b

m,b = 1,0
c.stroke(path.line(0,b,N,N*m+b),[color.rgb.green])

m,b = theilsen(samples)
c.stroke(path.line(0,b,N,N*m+b),[color.rgb.black])

def slr(samples):
    N = len(samples)
    sumxy = sum([x*y for x,y in samples])
    sumx = sum([x for x,y in samples])
    sumy = sum([y for x,y in samples])
    sumxx = sum([x*x for x,y in samples])
    m = (sumxy - sumx*sumy/N)/(sumxx - sumx**2/N)
    b = sumy/N - m*sumx/N
    return m,b

m,b = slr(samples)
c.stroke(path.line(0,b,N,N*m+b),[color.rgb.blue])

c.writePDFfile("ThielSen")
File history
Click on a date/time to view the file as it appeared at that time.
| Date/Time | Thumbnail | Dimensions | User | Comment | |
|---|---|---|---|---|---|
| current | 18:59, 3 November 2011 | | 2,936 × 3,075 (37 KB) | David Eppstein (talk | contribs) | Darker green, thicker lines |
| 23:40, 3 July 2011 |  | 2,936 × 3,075 (37 KB) | David Eppstein (talk | contribs) | {{Information |Description ={{en|1=The en:Theil–Sen estimator (black line) of a set of sample points, compared to the simple linear regression line (blue). The points were generated by adding a small amount of jitter to points on the green dashe |
You cannot overwrite this file.
File usage on Commons
The following page uses this file:
File usage on other wikis
The following other wikis use this file:
- Usage on ar.wikipedia.org
- Usage on el.wiktionary.org
- Usage on en.wikipedia.org
- Usage on es.wikipedia.org
- Usage on fa.wikipedia.org
- Usage on hy.wikipedia.org
- Usage on ko.wikipedia.org
- Usage on ru.wikipedia.org
- Usage on zh.wikipedia.org