File:Table isotopes de.svg
Jump to navigation
Jump to search

Size of this PNG preview of this SVG file: 419 × 600 pixels. Other resolutions: 168 × 240 pixels | 335 × 480 pixels | 537 × 768 pixels | 715 × 1,024 pixels | 1,431 × 2,048 pixels | 1,160 × 1,660 pixels.
Original file (SVG file, nominally 1,160 × 1,660 pixels, file size: 232 KB)
Captions
Captions
Add a one-line explanation of what this file represents
Summary
[edit]| Description |
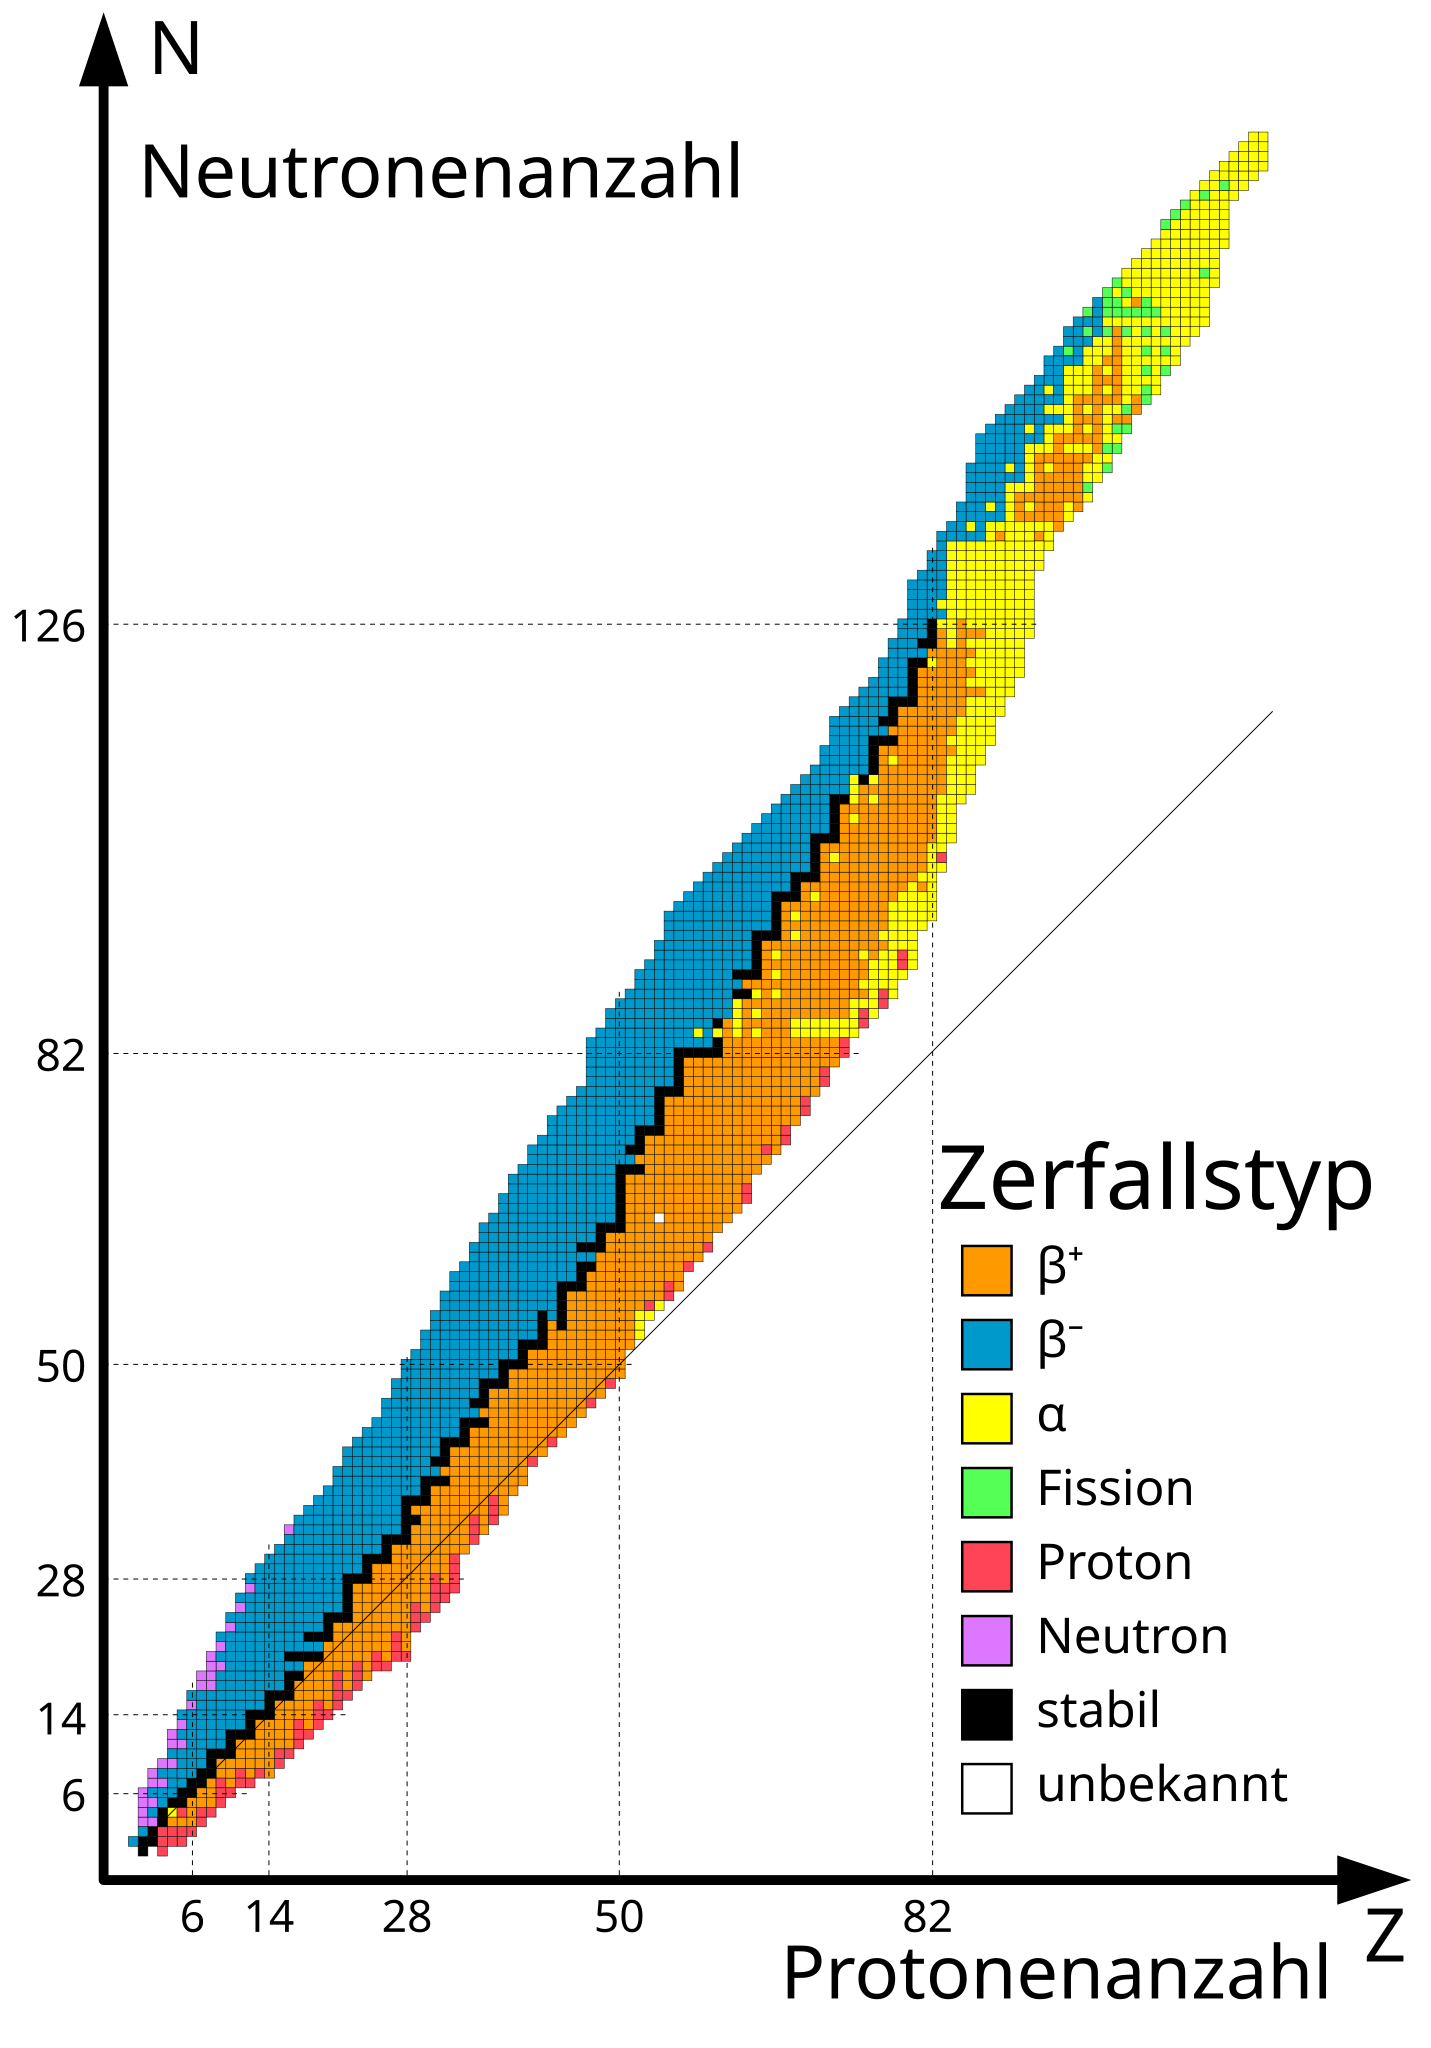
Deutsch: Auftragung von Isotopen nach Art des radioaktiven Zerfalls. Orange und blaue Nuklide sind instabil, schwarze Kästen dazwischen zeigen stabile Nuklide. Die durchgezogene Linie repräsentiert die theoretische Position der stabilen Nuklide bei der Protonen- und Neutronenanzahl identisch sind. Es zeigt sich, dass Elemente mit mehr als 20 Protonen mehr Neutronen benötigen um stabil zu sein. |
| Date | (UTC) |
| Source | |
| Author |
|
| Other versions |
[]
|


Licensing
[edit]
I, the copyright holder of this work, hereby publish it under the following licenses:
This file is licensed under the Creative Commons Attribution-Share Alike 3.0 Unported, 2.5 Generic, 2.0 Generic and 1.0 Generic license.
- You are free:
- to share – to copy, distribute and transmit the work
- to remix – to adapt the work
- Under the following conditions:
- attribution – You must give appropriate credit, provide a link to the license, and indicate if changes were made. You may do so in any reasonable manner, but not in any way that suggests the licensor endorses you or your use.
- share alike – If you remix, transform, or build upon the material, you must distribute your contributions under the same or compatible license as the original.

|
Permission is granted to copy, distribute and/or modify this document under the terms of the GNU Free Documentation License, Version 1.2 or any later version published by the Free Software Foundation; with no Invariant Sections, no Front-Cover Texts, and no Back-Cover Texts. A copy of the license is included in the section entitled GNU Free Documentation License. |
You may select the license of your choice.
Original upload log
[edit]
This image is a derivative work of the following images:
- File:Table_isotopes_en.svg licensed with Cc-by-sa-3.0,2.5,2.0,1.0, GFDL
- 2010-04-05T02:18:08Z Quibik 580x830 (219896 Bytes) Made the source code more compact.
- 2009-05-05T09:25:21Z Sjlegg 580x830 (711759 Bytes) {{Information |Description=Table of isotopes by type of nuclear decay. |Source=*[[:File:Table_isotopes.svg|]] |Date=2009-05-05 10:23 (UTC) |Author=*[[:File:Table_isotopes.svg|]]: [[User:Napy1kenobi|Napy1kenobi]] *derivative w
Uploaded with derivativeFX
File history
Click on a date/time to view the file as it appeared at that time.
| Date/Time | Thumbnail | Dimensions | User | Comment | |
|---|---|---|---|---|---|
| current | 15:41, 28 December 2019 | | 1,160 × 1,660 (232 KB) | Antonsusi (talk | contribs) | adjustings |
| 15:31, 28 December 2019 |  | 1,160 × 1,660 (284 KB) | Antonsusi (talk | contribs) | clear code | |
| 17:17, 30 May 2010 |  | 580 × 830 (487 KB) | Matthias M. (talk | contribs) | {{Information |Description={{de|Auftragung von Isotopen nach Art des radioaktiven Zerfalls. Orange und blaue Nuklide sind instabil, schwarze Kästen dazwischen zeigen stabile Nuklide. Die durchgezogene Linie repräsentiert die theoretische Position der st |
You cannot overwrite this file.
File usage on Commons
The following 11 pages use this file:
- File:Isotopentabelle.svg (file redirect)
- File:Nuklidkarte Segre.svg
- File:Table isotopes.svg
- File:Table isotopes de.svg
- File:Table isotopes en.svg
- File:Table isotopes eo.svg
- File:Table isotopes es.png
- File:Table isotopes it.png
- File:Table isotopes ru.svg
- File:ValléeDeStabilité2.JPG
- Template:Other versions/Table isotopes