File:Sunil Gavaskar Graph.png

Original file (963 × 492 pixels, file size: 8 KB, MIME type: image/png)
Captions
Captions
Copied from en:Image:Sunil Gavaskar Graph.png. -- Sundar 04:49, 28 February 2006 (UTC)
Summary[edit]
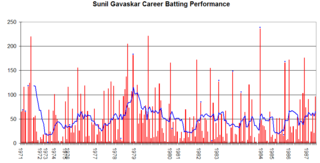
"This graph details the Test Match performance of Sunil Gavaskar. It was created by Raven4x4x. The red bars indicate the player's test match innings, while the blue line shows the average of the ten most recent innings at that point. Note that this average cannot be calculated for the first nine innings. The blue dots indicate innings in which Gavaskar finished not-out.
This graph was generated with Microsoft Excel 2002, using data from Cricinfo and Howstat.com.au."
Licensing[edit]
| I, the copyright holder of this work, release this work into the public domain. This applies worldwide. In some countries this may not be legally possible; if so: I grant anyone the right to use this work for any purpose, without any conditions, unless such conditions are required by law. |
File history
Click on a date/time to view the file as it appeared at that time.
| Date/Time | Thumbnail | Dimensions | User | Comment | |
|---|---|---|---|---|---|
| current | 04:48, 28 February 2006 | | 963 × 492 (8 KB) | Sundar (talk | contribs) | This graph details the Test Match performance of Sunil Gavaskar. It was created by Raven4x4x. The red bars indicate the player's test match innings, while the blue line shows the average of the t |
You cannot overwrite this file.
File usage on Commons
The following page uses this file:
File usage on other wikis
The following other wikis use this file:
- Usage on en.wikipedia.org
- Usage on kn.wikipedia.org
- Usage on mr.wikipedia.org
- Usage on ta.wikipedia.org