File:Spherical harmonics positive negative.svg
Jump to navigation
Jump to search

Size of this PNG preview of this SVG file: 265 × 251 pixels. Other resolutions: 253 × 240 pixels | 507 × 480 pixels | 811 × 768 pixels | 1,081 × 1,024 pixels | 2,162 × 2,048 pixels.
Original file (SVG file, nominally 265 × 251 pixels, file size: 22 KB)
Captions
Captions
Add a one-line explanation of what this file represents
Summary
[edit]
| Description |
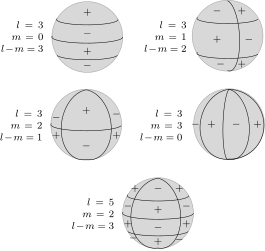
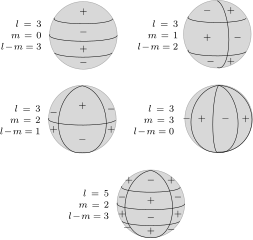
English: Representation of a spherical harmonic by discrepancy to a sphere. |
| Date | |
| Source | Own work |
| Author | Krishnavedala |
W3C-validity not checked.
| LaTeX source code |
|---|
\documentclass[12pt,border=1pt,tikz,class=scrartcl]{standalone}
\usepackage[T1]{fontenc}
\usepackage[utf8]{inputenc}
\usepackage{lmodern}
\usepackage{mathtools}

\usepackage{tikz-3dplot}
\usetikzlibrary{arrows,shapes,calc,positioning,matrix,fit}

\begin{document}
\scriptsize
\tdplotsetmaincoords{100}{170}
\begin{tikzpicture}[very thick,auto,
	info box/.style={align=right, text width=4em}]
	\node at (0,0) (p1) {\begin{tikzpicture}
		\draw[tdplot_screen_coords, fill=white!70!gray] (0,0) circle (1);
		\tdplotsinandcos {\sintheta}{\costheta}{0}
		\tdplotdrawarc {(0,0,-\sintheta)} {\costheta} {0} {-190} {} {}
		\tdplotsinandcos {\sintheta}{\costheta}{-30}
		\tdplotdrawarc {(0,0,-\sintheta)} {\costheta} {0} {-190} {} {}
		\tdplotsinandcos {\sintheta}{\costheta}{30}
		\tdplotdrawarc {(0,0,-\sintheta)} {\costheta} {-20} {-180} {} {}
		\node at (0,.7) {$+$};		\node at (0,.1) {$-$};
		\node at (0,-.4) {$+$};	\node at (0,-.8) {$-$};
	\end{tikzpicture}
	};
	\node [left=-.3em of p1,info box] {$l=3$\\$m=0$\\$l-m=3$};
	\node at (4,0) (p2) {\begin{tikzpicture}
		\draw[tdplot_screen_coords, fill=white!70!gray] (0,0) circle (1);
		\tdplotsinandcos {\sintheta}{\costheta}{-30}
		\tdplotdrawarc {(0,0,-\sintheta)} {\costheta} {0} {-180} {} {}
		\tdplotsinandcos {\sintheta}{\costheta}{30}
		\tdplotdrawarc {(0,0,-\sintheta)} {\costheta} {0} {-180} {} {}
		\tdplotsetthetaplanecoords{60}\tdplotdrawarc [tdplot_rotated_coords] {(0,0,0)} {1} {-180} {0} {} {}
		\node at (.4,.7) {$+$};	\node at (-.3,.7) {$-$};
		\node at (.6,-.1) {$-$};	\node at (-.3,-.1) {$+$};
		\node at (.4,-.8) {$+$};	\node at (-.2,-.8) {$-$};
	\end{tikzpicture}
	};
	\node [left=-.3em of p2,info box] {$l=3$\\$m=1$\\$l-m=2$};
	\node at (0,-2.5) (p3) {\begin{tikzpicture}
		\draw[tdplot_screen_coords, fill=white!70!gray] (0,0) circle (1);
		\tdplotsinandcos {\sintheta}{\costheta}{0}
		\tdplotdrawarc {(0,0,-\sintheta)} {\costheta} {0} {-180} {} {}
		\tdplotsetthetaplanecoords{35}\tdplotdrawarc [tdplot_rotated_coords] {(0,0,0)} {1} {0} {-180} {} {}
		\tdplotsetthetaplanecoords{125}\tdplotdrawarc [tdplot_rotated_coords] {(0,0,0)} {1} {0} {-180} {} {}
		\node at (-.85,.2) {$-$};	\node at (0,.4) {$+$};		\node at (.85,.3) {$-$};
		\node at (-.85,-.3) {$+$};		\node at (0,-.6) {$-$};		\node at (.85,-.3) {$+$};
	\end{tikzpicture}
	};
	\node [left=-.3em of p3,info box] {$l=3$\\$m=2$\\$l-m=1$};
	\node at (4,-2.5) (p4) {\begin{tikzpicture}
		\draw[tdplot_screen_coords, fill=white!70!gray] (0,0) circle (1);
		\tdplotsetthetaplanecoords{0}\tdplotdrawarc [tdplot_rotated_coords] {(0,0,0)} {1} {0} {-180} {} {}
		\tdplotsetthetaplanecoords{45}\tdplotdrawarc [tdplot_rotated_coords] {(0,0,0)} {1} {0} {-180} {} {}
		\tdplotsetthetaplanecoords{90}\tdplotdrawarc [tdplot_rotated_coords] {(0,0,0)} {1} {0} {-180} {} {}
		\tdplotsetthetaplanecoords{135}\tdplotdrawarc [tdplot_rotated_coords] {(0,0,0)} {1} {0} {-180} {} {}
		\node at (-.95,0) {$-$};	\node at (-.5,0) {$+$};
		\node at (.2,0) {$-$};		\node at (.8,0) {$+$};
	\end{tikzpicture}
	};
	\node [left=-.3em of p4,info box] {$l=3$\\$m=3$\\$l-m=0$};
	\node at (2,-5) (p5) {\begin{tikzpicture}
		\draw[tdplot_screen_coords, fill=white!70!gray] (0,0) circle (1);
		\tdplotsinandcos {\sintheta}{\costheta}{0}
		\tdplotdrawarc {(0,0,-\sintheta)} {\costheta} {0} {-190} {} {}
		\tdplotsinandcos {\sintheta}{\costheta}{-30}
		\tdplotdrawarc {(0,0,-\sintheta)} {\costheta} {0} {-190} {} {}
		\tdplotsinandcos {\sintheta}{\costheta}{30}
		\tdplotdrawarc {(0,0,-\sintheta)} {\costheta} {-20} {-180} {} {}
		\tdplotsetthetaplanecoords{40}\tdplotdrawarc [tdplot_rotated_coords] {(0,0,0)} {1} {0} {-180} {} {}
		\tdplotsetthetaplanecoords{130}\tdplotdrawarc [tdplot_rotated_coords] {(0,0,0)} {1} {0} {-180} {} {}
		\node at (-.65,.7) {$+$};	\node at (0,.7) {$-$};	\node at (.6,.7) {$+$};
		\node at (-.85,.2) {$-$};	\node at (0,.1) {$+$};	\node at (.8,.2) {$-$};
		\node at (-.7,-.7) {$-$};	\node at (0,-.8) {$+$};	\node at (.6,-.75) {$-$};
		\node at (-.85,-.3) {$+$};	\node at (0,-.4) {$-$};	\node at (.8,-.3) {$+$};
	\end{tikzpicture}
	};
	\node [left=-.3em of p5,info box] {$l=5$\\$m=2$\\$l-m=3$};
\end{tikzpicture}
\end{document}
|
Licensing
[edit]
I, the copyright holder of this work, hereby publish it under the following license:
This file is licensed under the Creative Commons Attribution-Share Alike 4.0 International license.
- You are free:
- to share – to copy, distribute and transmit the work
- to remix – to adapt the work
- Under the following conditions:
- attribution – You must give appropriate credit, provide a link to the license, and indicate if changes were made. You may do so in any reasonable manner, but not in any way that suggests the licensor endorses you or your use.
- share alike – If you remix, transform, or build upon the material, you must distribute your contributions under the same or compatible license as the original.
File history
Click on a date/time to view the file as it appeared at that time.
| Date/Time | Thumbnail | Dimensions | User | Comment | |
|---|---|---|---|---|---|
| current | 23:43, 1 December 2014 | | 265 × 251 (22 KB) | Krishnavedala (talk | contribs) | User created page with UploadWizard |
You cannot overwrite this file.
File usage on Commons
The following 3 pages use this file:
File usage on other wikis
The following other wikis use this file:
- Usage on de.wikipedia.org
- Usage on en.wikipedia.org
- Usage on pt.wikipedia.org
- Usage on tr.wikipedia.org
- Usage on vi.wikipedia.org
- Usage on zh.wikipedia.org