File:South Africa 2001 dominant language map.svg
Jump to navigation
Jump to search

Size of this PNG preview of this SVG file: 689 × 600 pixels. Other resolutions: 276 × 240 pixels | 552 × 480 pixels | 882 × 768 pixels | 1,177 × 1,024 pixels | 2,353 × 2,048 pixels | 1,072 × 933 pixels.
Original file (SVG file, nominally 1,072 × 933 pixels, file size: 1,024 KB)
Captions
Captions
Add a one-line explanation of what this file represents
Summary
[edit]
| Description |
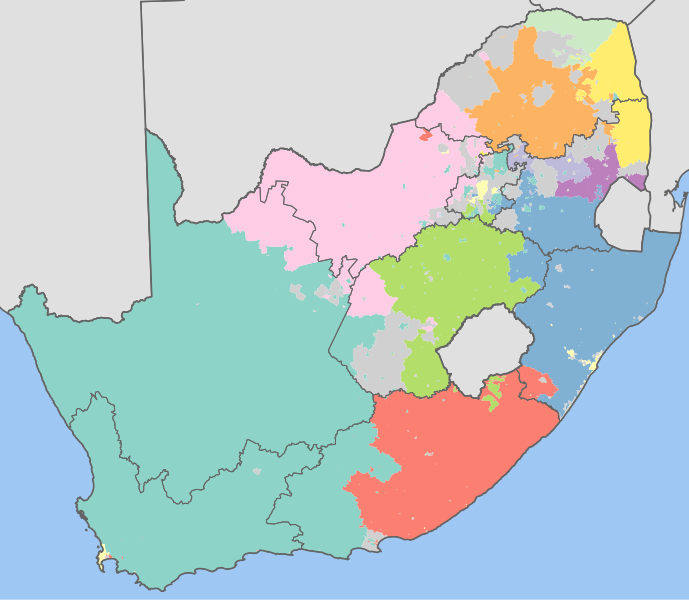
English: Map showing the dominant home languages in South Africa, according to Census 2001 at the "Main Place" level. In this context, a language is dominant if it more than 50% of the population in an area speak it at home, or more than 33% speak it and no other language is spoken by more than 25%.
Afrikaans
English
isiNdebele
isiXhosa
isiZulu
Sesotho sa Leboa
Sesotho
Setswana
siSwati
Tshivenda
Xitsonga
No language dominant
Projection is Albers Equal-Area Conic, with standard parallels at 25.5° S and 31.5° S, and origin at 28.5° S 25.5° E. |
| Date | |
| Source | Statistics South Africa's Census 2001 is the source of the basic population data. The map results from my own processing of the data. |
| Author | Htonl |
Licensing
[edit]
The following license applies to the population data on which the map is based:

|
The copyright holder of this file, Stats SA, allows anyone to use it for any purpose, provided that the copyright holder is properly attributed. Redistribution, derivative work, commercial use, and all other use is permitted. |
Attribution:
"the user acknowledges Stats SA as the source of the basic data wherever they process, apply, utilise, publish or distribute the data, and also that they specify that the relevant application and analysis (where applicable) result from their own processing of the data" [1]
|
The following tag applies to the map itself:
| I, the copyright holder of this work, release this work into the public domain. This applies worldwide. In some countries this may not be legally possible; if so: I grant anyone the right to use this work for any purpose, without any conditions, unless such conditions are required by law. |
File history
Click on a date/time to view the file as it appeared at that time.
| Date/Time | Thumbnail | Dimensions | User | Comment | |
|---|---|---|---|---|---|
| current | 11:42, 29 November 2010 | | 1,072 × 933 (1,024 KB) | Htonl (talk | contribs) | tweak |
| 14:18, 2 October 2010 |  | 1,072 × 933 (1.02 MB) | Htonl (talk | contribs) | new approach, smaller filesize | |
| 21:51, 1 October 2010 |  | 1,072 × 933 (2.92 MB) | Htonl (talk | contribs) | Reverted to version as of 17:41, 1 October 2010 | |
| 21:33, 1 October 2010 |  | 1,072 × 933 (2.79 MB) | Htonl (talk | contribs) | tweak | |
| 17:41, 1 October 2010 |  | 1,072 × 933 (2.92 MB) | Htonl (talk | contribs) | use equal-area projection | |
| 18:50, 16 February 2010 |  | 1,000 × 786 (2.81 MB) | Htonl (talk | contribs) | tweak | |
| 19:49, 7 February 2010 |  | 1,000 × 786 (3.04 MB) | Htonl (talk | contribs) | and again | |
| 19:43, 7 February 2010 |  | 1,000 × 786 (3.04 MB) | Htonl (talk | contribs) | change "none" colour | |
| 00:50, 7 February 2010 |  | 1,000 × 786 (3.04 MB) | Htonl (talk | contribs) | =={{int:filedesc}}== {{Information |Description={{en|1=Map showing the dominant homelanguages in South Africa, according to Census 2001 at the "Main Place" level. In this context, a language is dominant if it more than 50% of the population in an area spe |
You cannot overwrite this file.
File usage on Commons
There are no pages that use this file.
File usage on other wikis
The following other wikis use this file:
- Usage on zh.wikipedia.org