File:Population structure of Mlabri and others (inferred by STRUCTURE and frappe).png

Original file (1,200 × 1,684 pixels, file size: 1,023 KB, MIME type: image/png)
Captions
Captions
| DescriptionPopulation structure of Mlabri and others (inferred by STRUCTURE and frappe).png |
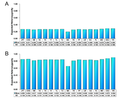
English: Estimated population structure inferred by (A) software 'STRUCTURE' and (B) software 'frappe'. Each colored vertical line represents an individual that is assigned proportionally to one of the K clusters with the proportions represented by the relative lengths of the K different colors. Black lines separate individuals of different populations. Populations are labeled below the figure with the same convention shown in Population ID table. For both STRUCTURE and frappe results, the figure shown for a given K is based on the highest probability run of ten runs at that K.
|
| Date | Published: 19 March 2010 |
| Source | Xu S, Kangwanpong D, Seielstad M, et al. Genetic evidence supports linguistic affinity of Mlabri - a hunter-gatherer group in Thailand. BMC Genetics. 2010;11:18. doi:10.1186/1471-2156-11-18. https://bmcgenet.biomedcentral.com/articles/10.1186/1471-2156-11-18 |
| Author | Shuhua Xu, Daoroong Kangwanpong, Mark Seielstad, Metawee Srikummool, Jatupol Kampuansai, Li JinEmail author and The HUGO Pan-Asian SNP Consortium |
| Other versions |
|
Population ID[edit]
|
Population ID |
Ethnicity |
Language family |
Language |
Sample-size |
|---|---|---|---|---|
|
JPT |
Japanese |
Japonic |
Japanese |
44 |
|
CHB |
Han |
Sino-Tibetan |
Chinese |
45 |
|
HM |
Hmong |
Hmong-Mien |
Hmong |
20 |
|
YA |
Yao |
Hmong-Mien |
Iu-Mien |
19 |
|
TL |
Tai Lue |
Tai-Kadai |
Lue |
20 |
|
TY |
Tai Yong |
Tai-Kadai |
Yong |
18 |
|
TK |
Tai Kern |
Tai-Kadai |
Kern |
18 |
|
TU |
Tai Yuan |
Tai-Kadai |
Yuan |
20 |
|
PL |
Palong |
Austro-Asiatic |
Palong |
18 |
|
KA |
Karen |
Sino-Tibetan |
Karen |
20 |
|
LW |
Lawa |
Austro-Asiatic |
Lawa |
19 |
|
PP |
Plang |
Austro-Asiatic |
Blang |
18 |
|
TN |
Htin |
Austro-Asiatic |
Mal |
18 |
|
MA |
Mlabri |
Austro-Asiatic |
Mlabri |
18 |
|
MO |
Mon |
Austro-Asiatic |
Mon |
19 |
|
CEU |
European |
Indo-European |
English |
60 |
|
YRI |
Yoruba |
Niger-Congo |
Yoruba |
60 |
This file is licensed under the Creative Commons Attribution 2.0 Generic license.
|
This file was published in a BioMed Central journal. Their website states that all of its research publications is published under the license which is identical to the Creative Commons Attribution 2.0 license (some non-research articles like reviews or editorials may require a subscription.)
To the uploader: You must provide a link (URL) to the original file or journal article. English | 日本語 | македонски | +/− |
File history
Click on a date/time to view the file as it appeared at that time.
| Date/Time | Thumbnail | Dimensions | User | Comment | |
|---|---|---|---|---|---|
| current | 14:29, 18 May 2017 |  | 1,200 × 1,684 (1,023 KB) | 일성강 (talk | contribs) | fixed |
| 14:46, 25 January 2017 |  | 1,200 × 1,684 (871 KB) | Was a bee (talk | contribs) | {{Information |Description={{en|1=Estimated population structure inferred by '''(A)''' STRUCTURE and '''(B)''' frappe. Each colored vertical line represents an individual that is assigned proportionally to one of the K clusters with the proportions rep... |
You cannot overwrite this file.
File usage on Commons
The following 6 pages use this file:
- File:Expected heterozygosity of Mlabri.png
- File:Geographical distribution of Thailand population samples.png
- File:Maximum likelihood tree of 17 populations including Mlabri.png
- File:Neighbor-Joining tree of Mlabri and others based on allele sharing distance.png
- File:PCA plot for 446 individuals representing 15 populations including Mlabri.png
- File:Population structure of Mlabri and others (inferred by STRUCTURE and frappe).png
Metadata
This file contains additional information such as Exif metadata which may have been added by the digital camera, scanner, or software program used to create or digitize it. If the file has been modified from its original state, some details such as the timestamp may not fully reflect those of the original file. The timestamp is only as accurate as the clock in the camera, and it may be completely wrong.
| Horizontal resolution | 37.8 dpc |
|---|---|
| Vertical resolution | 37.8 dpc |


