File:Plasma scaling.svg
Jump to navigation
Jump to search

Size of this PNG preview of this SVG file: 400 × 400 pixels. Other resolutions: 240 × 240 pixels | 480 × 480 pixels | 768 × 768 pixels | 1,024 × 1,024 pixels | 2,048 × 2,048 pixels.
Original file (SVG file, nominally 400 × 400 pixels, file size: 26 KB)
Captions
Captions
Add a one-line explanation of what this file represents
Summary[edit]
| Description |
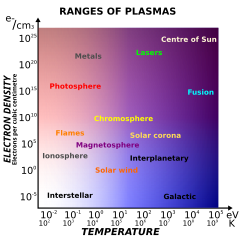
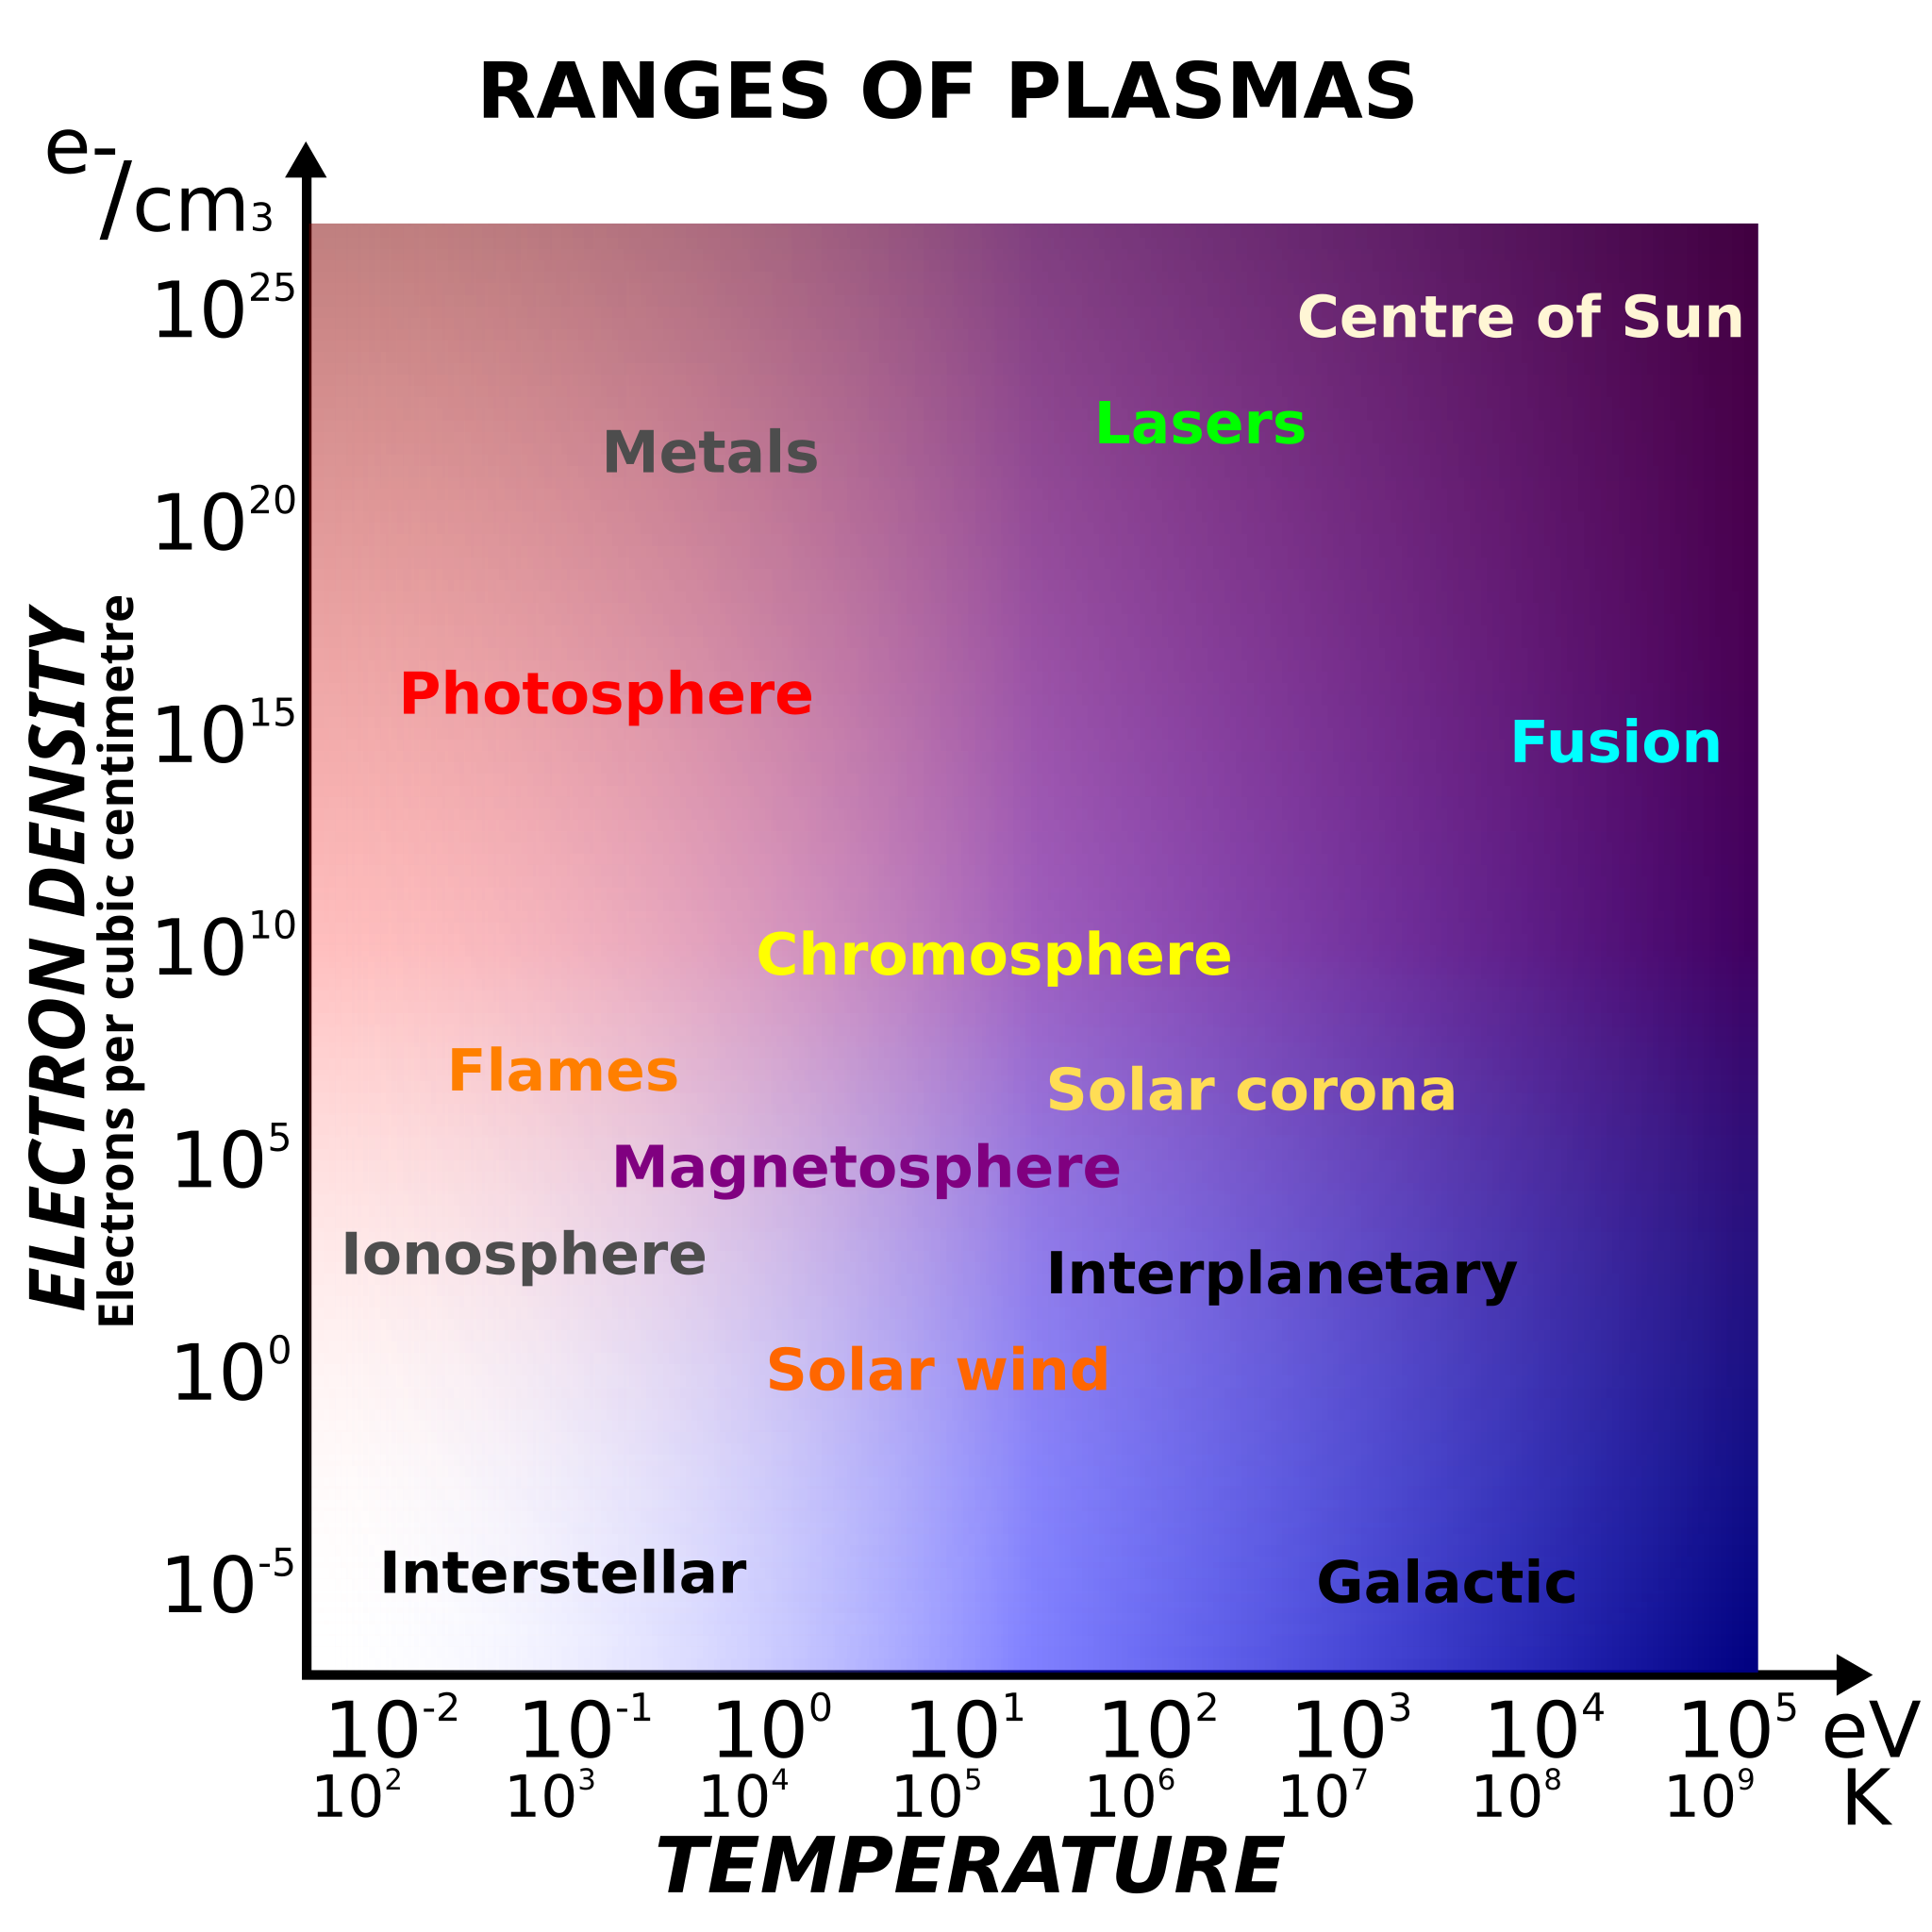
English: Roughly drawn graph showing how the properties of plasmas can vary by many orders of magnitude. Converted to SVG from :Image:Ranges of Plasmas graph.png and enhanced in full Technicolor.
Disclaimer: The raster looks bad at press time, as seen above. Whether the vector image itself is a marvellous work of art is left to one's own viewpoint. However, cosmetic improvements to Wikipedia or this image are welcome. |
| Date | 14 August 2008 (original upload date) |
| Source | Transferred from en.wikipedia to Commons. |
| Author | Jafet.vixle at English Wikipedia |
Licensing[edit]
| This work has been released into the public domain by its author, Jafet.vixle at English Wikipedia. This applies worldwide. In some countries this may not be legally possible; if so: Jafet.vixle grants anyone the right to use this work for any purpose, without any conditions, unless such conditions are required by law. |
Original upload log[edit]
The original description page was here. All following user names refer to en.wikipedia.
File history
Click on a date/time to view the file as it appeared at that time.
| Date/Time | Thumbnail | Dimensions | User | Comment | |
|---|---|---|---|---|---|
| current | 22:46, 2 October 2012 | | 400 × 400 (26 KB) | Magog the Ogre (talk | contribs) | Reverted to version as of 14:07, 18 August 2008 |
| 22:46, 2 October 2012 |  | 400 × 400 (31 KB) | OgreBot (talk | contribs) | (BOT): Uploading old version of file from en.wikipedia; originally uploaded on 2008-08-14 13:42:32 by Jafet | |
| 14:07, 18 August 2008 |  | 400 × 400 (26 KB) | Croquant (talk | contribs) | {{Information |Description={{en|Roughly drawn graph showing how the properties of plasmas can vary by many en:orders of magnitude. Converted to SVG from [[:en::Image:Ranges of Plasmas graph.pn |
You cannot overwrite this file.
File usage on Commons
The following 2 pages use this file:
File usage on other wikis
The following other wikis use this file:
- Usage on bg.wikipedia.org
- Usage on bs.wikipedia.org
- Usage on ca.wikipedia.org
- Usage on chr.wikipedia.org
- Usage on da.wikipedia.org
- Usage on et.wikipedia.org
- Usage on fr.wikipedia.org
- Usage on hi.wikipedia.org
- Usage on hr.wikipedia.org
- Usage on ka.wikipedia.org
- Usage on lez.wikipedia.org
- Usage on mk.wikipedia.org
- Usage on pt.wikipedia.org
- Usage on sh.wikipedia.org
- Usage on si.wikipedia.org
- Usage on sr.wikipedia.org
- Usage on tr.wikipedia.org