File:PcaIdea.png
Jump to navigation
Jump to search
Size of this preview: 600 × 600 pixels. Other resolutions: 240 × 240 pixels | 480 × 480 pixels | 700 × 700 pixels.
Original file (700 × 700 pixels, file size: 4 KB, MIME type: image/png)
Captions
Captions
Add a one-line explanation of what this file represents
Summary[edit]
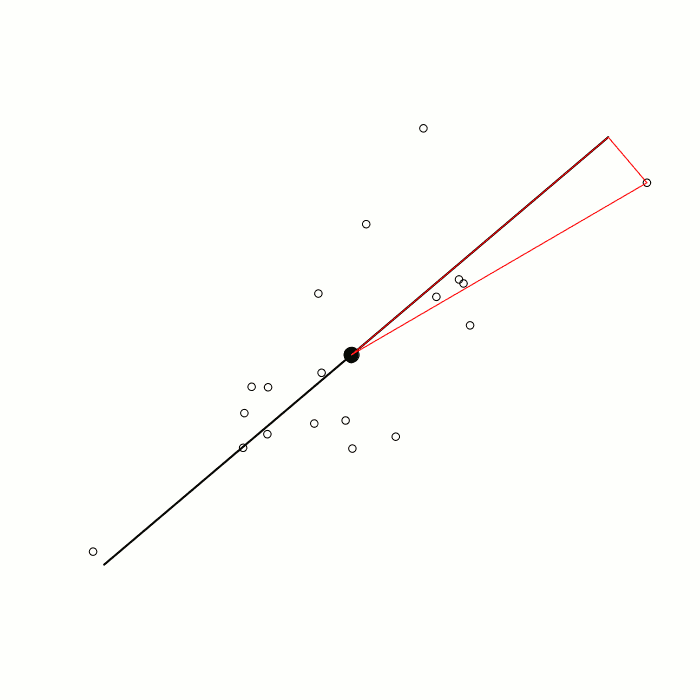
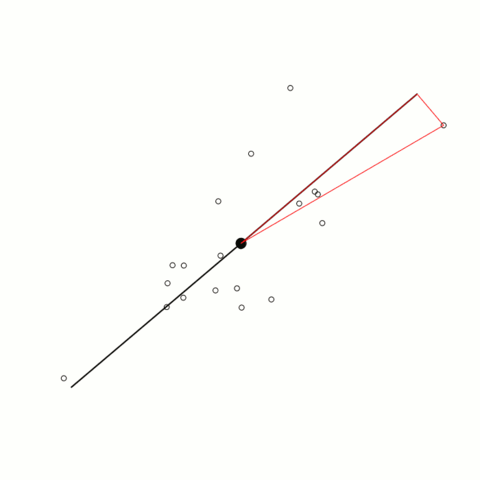
| Description | Visualize the idea of principal component analysis |
| Date | |
| Source | Own work |
| Author | Sigbert (talk) 14:28, 30 October 2009 (UTC) |
library(mvtnorm)
library(MASS)
set.seed(09101964)
s   <- matrix(c(1, 0.8, 0.8, 1), nr=2)
x   <- rmvnorm(20, sigma=s)
x   <- sweep(x, 2, apply(x, 2, mean))
d   <- sqrt(x[,1]*x[,1]+x[,2]*x[,2])
pos <- which.max(d)
d   <- max(d)
pca <- princomp(x)
eqscplot(x, axes=F)
mx  <- apply(x, 2, mean)
points(x=mx[1], y=mx[2], pch=19, cex=2)
psi <- min(pca$scores[,1])
psa <- max(pca$scores[,1])
p1  <- pca$loadings[,1]*psi
p2  <- pca$loadings[,1]*psa
pc1 <- matrix(c(p1,p2), nc=2, byrow=T)
lines(pc1, col="black", lwd=2)
if (-psi>psa) p3 <- p1 else p3 <- p2
lines(x=c(mx[1],p3[1], x[pos,1], mx[1]),y=c(mx[2], p3[2], x[pos,2], mx[2]), col="red", lwd=1)
Licensing[edit]
| I, the copyright holder of this work, release this work into the public domain. This applies worldwide. In some countries this may not be legally possible; if so: I grant anyone the right to use this work for any purpose, without any conditions, unless such conditions are required by law. |
File history
Click on a date/time to view the file as it appeared at that time.
| Date/Time | Thumbnail | Dimensions | User | Comment | |
|---|---|---|---|---|---|
| current | 14:28, 30 October 2009 | | 700 × 700 (4 KB) | Sigbert (talk | contribs) | {{Information |Description=Visualize the idea of principal component analysis |Source=self-made |Date=30 Oct 2009 |Author= ~~~~ |other_versions= }} |
You cannot overwrite this file.
File usage on Commons
There are no pages that use this file.
File usage on other wikis
The following other wikis use this file:
- Usage on de.wikipedia.org